1805 Eubanks St Houston, TX 77093
Eastex-Jensen NeighborhoodEstimated Value: $230,000 - $262,000
3
Beds
3
Baths
1,896
Sq Ft
$130/Sq Ft
Est. Value
About This Home
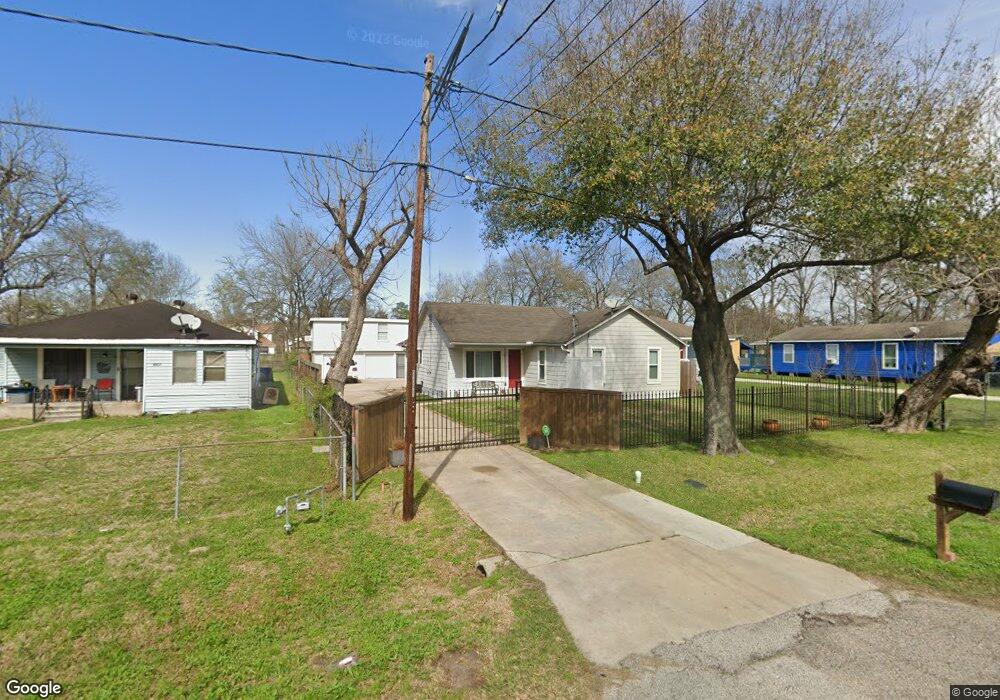
This home is located at 1805 Eubanks St, Houston, TX 77093 and is currently estimated at $246,833, approximately $130 per square foot. 1805 Eubanks St is a home located in Harris County with nearby schools including Berry Elementary School, Patrick Henry Middle School, and Kashmere High School.
Ownership History
Date
Name
Owned For
Owner Type
Purchase Details
Closed on
Apr 10, 2014
Sold by
Bluestar Properties Two Llc
Bought by
Cantu Antonio Humberto
Current Estimated Value
Home Financials for this Owner
Home Financials are based on the most recent Mortgage that was taken out on this home.
Original Mortgage
$115,862
Outstanding Balance
$87,777
Interest Rate
4.25%
Mortgage Type
FHA
Estimated Equity
$159,056
Purchase Details
Closed on
Sep 9, 2010
Sold by
Segovia Alonso and Prado Aurelia S
Bought by
Csi International Inc
Purchase Details
Closed on
Aug 10, 2010
Sold by
Csi International Inc
Bought by
Bluestar Properties Two Llc
Purchase Details
Closed on
Apr 23, 2008
Sold by
Ramos Robert
Bought by
Segovia Alonso
Purchase Details
Closed on
Sep 10, 2007
Sold by
Prado Abundio
Bought by
Ramos Robert
Create a Home Valuation Report for This Property
The Home Valuation Report is an in-depth analysis detailing your home's value as well as a comparison with similar homes in the area
Home Values in the Area
Average Home Value in this Area
Purchase History
| Date | Buyer | Sale Price | Title Company |
|---|---|---|---|
| Cantu Antonio Humberto | -- | Alamo Title Co | |
| Csi International Inc | $30,000 | None Available | |
| Bluestar Properties Two Llc | -- | None Available | |
| Segovia Alonso | -- | None Available | |
| Ramos Robert | -- | None Available |
Source: Public Records
Mortgage History
| Date | Status | Borrower | Loan Amount |
|---|---|---|---|
| Open | Cantu Antonio Humberto | $115,862 |
Source: Public Records
Tax History
| Year | Tax Paid | Tax Assessment Tax Assessment Total Assessment is a certain percentage of the fair market value that is determined by local assessors to be the total taxable value of land and additions on the property. | Land | Improvement |
|---|---|---|---|---|
| 2025 | $2,587 | $223,287 | $75,000 | $148,287 |
| 2024 | $2,587 | $210,000 | $75,000 | $135,000 |
| 2023 | $2,587 | $210,000 | $75,000 | $135,000 |
| 2022 | $3,750 | $196,849 | $63,000 | $133,849 |
| 2021 | $3,609 | $167,793 | $48,000 | $119,793 |
| 2020 | $3,831 | $158,211 | $48,000 | $110,211 |
| 2019 | $3,238 | $127,966 | $36,000 | $91,966 |
| 2018 | $2,706 | $106,941 | $24,000 | $82,941 |
| 2017 | $2,704 | $106,941 | $24,000 | $82,941 |
| 2016 | $2,704 | $106,941 | $24,000 | $82,941 |
| 2015 | $3,193 | $106,941 | $24,000 | $82,941 |
| 2014 | $3,193 | $124,213 | $24,000 | $100,213 |
Source: Public Records
Map
Nearby Homes
- 1815 Eubanks St
- 2405 Mann St
- 2418 Deams St
- 2017 Sadler St
- 2413 E Crosstimbers St
- 8109 W Hardy Rd
- 2610 Huntington Creek Ln
- 7722 West St
- 2608 Bostic St
- 7718 Duncan St
- 2602 E Crosstimbers St
- 1115 Post St
- 909 Yorkshire St Unit 8
- 2120 Vance St
- 741 Mcdaniel St
- 1104 Charnwood St
- 1009 Wainwright St
- 2609 Eva St
- 743 Apache St
- 726 Mcdaniel St
- 1809 Eubanks St
- 1801 Eubanks St
- 1721 Eubanks St
- 1817 Eubanks St
- 1824 Eubanks St
- 1808 Deams St
- 1810 Deams St
- 1806 Deams St
- 1717 Eubanks St
- 1812 Deams St
- 1806 Eubanks St
- 1810 Eubanks St
- 1802 Eubanks St
- 1802 Eubanks St
- 1802 Eubanks St Unit B
- 1814 Deams St
- 1819 Eubanks St
- 1722 Eubanks St
- 1709 Eubanks St
- 1816 Eubanks St
Your Personal Tour Guide
Ask me questions while you tour the home.