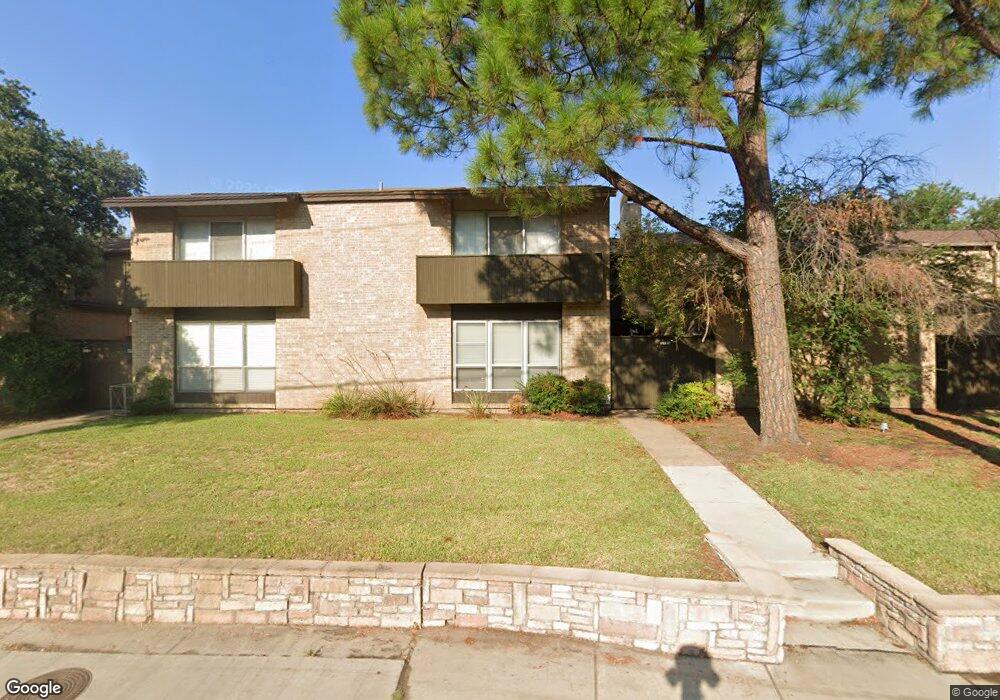
1805 N Macarthur Blvd Unit 1805 Irving, TX 75061
Hospital District NeighborhoodEstimated Value: $220,000 - $247,000
3
Beds
3
Baths
1,617
Sq Ft
$145/Sq Ft
Est. Value
About This Home
This home is located at 1805 N Macarthur Blvd Unit 1805, Irving, TX 75061 and is currently estimated at $233,947, approximately $144 per square foot. 1805 N Macarthur Blvd Unit 1805 is a home located in Dallas County with nearby schools including Lively Elementary School, Lorenzo De Zavala Middle, and Irving High School.
Ownership History
Date
Name
Owned For
Owner Type
Purchase Details
Closed on
Sep 1, 2017
Sold by
Hines Kim
Bought by
Hins Kimberly Jeans and Kimberly Ey Jean Hines Revocable
Current Estimated Value
Purchase Details
Closed on
Sep 17, 2002
Sold by
Demayo Brenda
Bought by
Hines Kim
Home Financials for this Owner
Home Financials are based on the most recent Mortgage that was taken out on this home.
Original Mortgage
$84,400
Outstanding Balance
$34,664
Interest Rate
6.01%
Mortgage Type
Purchase Money Mortgage
Estimated Equity
$199,283
Purchase Details
Closed on
May 20, 1998
Sold by
Brunner Juanita L
Bought by
Demayo Brenda
Home Financials for this Owner
Home Financials are based on the most recent Mortgage that was taken out on this home.
Original Mortgage
$75,900
Interest Rate
7.22%
Mortgage Type
FHA
Create a Home Valuation Report for This Property
The Home Valuation Report is an in-depth analysis detailing your home's value as well as a comparison with similar homes in the area
Home Values in the Area
Average Home Value in this Area
Purchase History
| Date | Buyer | Sale Price | Title Company |
|---|---|---|---|
| Hins Kimberly Jeans | -- | None Available | |
| Hines Kim | -- | -- | |
| Demayo Brenda | -- | -- |
Source: Public Records
Mortgage History
| Date | Status | Borrower | Loan Amount |
|---|---|---|---|
| Open | Hines Kim | $84,400 | |
| Previous Owner | Demayo Brenda | $75,900 |
Source: Public Records
Tax History Compared to Growth
Tax History
| Year | Tax Paid | Tax Assessment Tax Assessment Total Assessment is a certain percentage of the fair market value that is determined by local assessors to be the total taxable value of land and additions on the property. | Land | Improvement |
|---|---|---|---|---|
| 2025 | $3,446 | $242,290 | $52,520 | $189,770 |
| 2024 | $3,446 | $240,380 | $52,520 | $187,860 |
| 2023 | $3,446 | $234,470 | $31,510 | $202,960 |
| 2022 | $5,407 | $234,470 | $31,510 | $202,960 |
| 2021 | $4,497 | $185,960 | $31,510 | $154,450 |
| 2020 | $4,666 | $185,960 | $31,510 | $154,450 |
| 2019 | $4,931 | $185,960 | $31,510 | $154,450 |
| 2018 | $3,903 | $145,530 | $31,510 | $114,020 |
| 2017 | $3,223 | $119,660 | $31,510 | $88,150 |
| 2016 | $3,223 | $119,660 | $31,510 | $88,150 |
| 2015 | $2,406 | $107,360 | $31,510 | $75,850 |
| 2014 | $2,406 | $107,360 | $31,510 | $75,850 |
Source: Public Records
Map
Nearby Homes
- 1809 N Macarthur Blvd
- 1710 Timbers Dr
- 816 Glenview Dr
- 1701 Timbers Dr
- 909 W Grauwyler Rd
- 1509 Glenbrook Dr
- 1519 Sunnybrook Dr
- 1513 Canyon Oaks Dr
- 1317 Broadmoor Ln
- 1620 Oak Meadow Dr
- 1401 N Rogers Rd
- 1604 Oak Meadow Dr
- 1401 Limetree Ln
- 2101 Oakhurst Dr Unit A-D
- 1313 Limetree Ln
- 1721 Del Rancho Dr
- 1206 N O Connor Rd
- 2405 Summit Dr
- 1118 Brady Dr
- 1719 Belmead Ln
- 1803 N Macarthur Blvd Unit 1803
- 1803 N Macarthur Blvd Unit 1803
- 1801 N Macarthur Blvd
- 1801 N Macarthur Blvd Unit B
- 1807 Pueblo Place Unit 1807
- 1805 Pueblo Place Unit 1805
- 1803 Pueblo Place Unit 1803
- 1100 Lane St Unit 1100
- 1100 Lane St
- 1801 Pueblo Place Unit 1801
- 1801 Pueblo Place Unit D
- 1801 Pueblo Place
- 1102 Lane St
- 1104A Lane St Unit 1104
- 1104 Lane St Unit A
- 1106 Lane St Unit A
- 1022 Glencrest Ct
- 1809 Pueblo Place Unit 1809
- 1100A Lane St Unit 1100
- 1102A Lane St Unit 1102