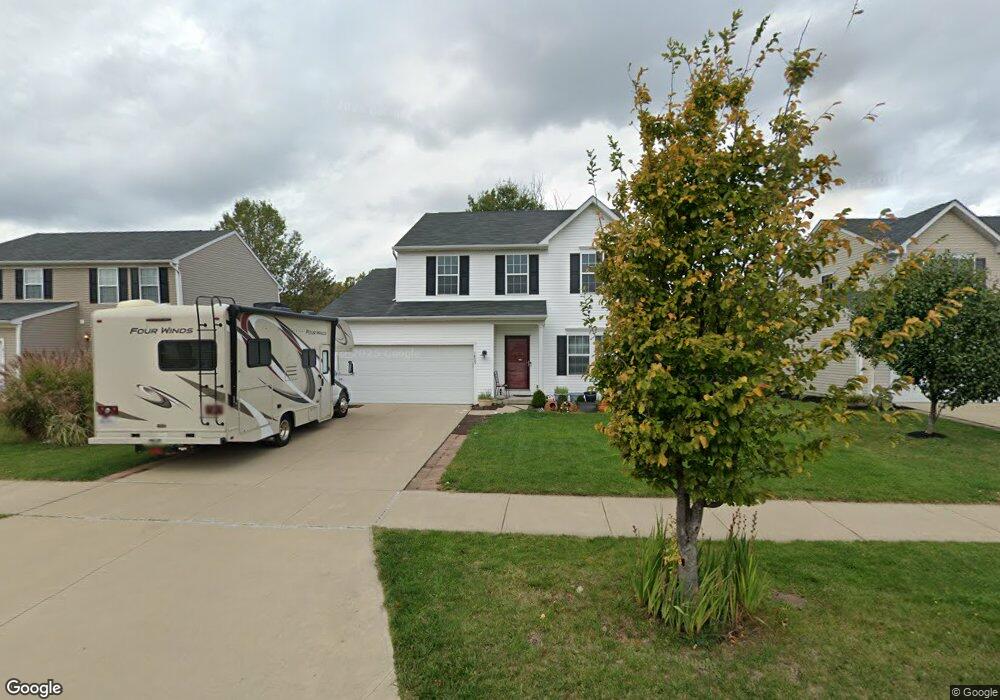
1805 North Ashwood Dr Painesville, OH 44077
Estimated Value: $355,659 - $385,000
3
Beds
3
Baths
1,308
Sq Ft
$278/Sq Ft
Est. Value
About This Home
This home is located at 1805 North Ashwood Dr, Painesville, OH 44077 and is currently estimated at $363,165, approximately $277 per square foot. 1805 North Ashwood Dr is a home located in Lake County with nearby schools including Henry F. Lamuth Middle School, Riverside Junior/Senior High School, and Our Shepherd Lutheran School.
Ownership History
Date
Name
Owned For
Owner Type
Purchase Details
Closed on
Apr 29, 2014
Sold by
Wickman David J and Wickman Chelsea
Bought by
Lee Kyung M and Kim Mira
Current Estimated Value
Home Financials for this Owner
Home Financials are based on the most recent Mortgage that was taken out on this home.
Original Mortgage
$163,500
Outstanding Balance
$124,606
Interest Rate
4.33%
Mortgage Type
New Conventional
Estimated Equity
$238,559
Purchase Details
Closed on
May 13, 2010
Sold by
Nvr Inc
Bought by
Wickman David J
Home Financials for this Owner
Home Financials are based on the most recent Mortgage that was taken out on this home.
Original Mortgage
$166,983
Interest Rate
4.75%
Mortgage Type
FHA
Purchase Details
Closed on
Apr 13, 2009
Sold by
Mortell Associates
Bought by
Nvr Inc
Create a Home Valuation Report for This Property
The Home Valuation Report is an in-depth analysis detailing your home's value as well as a comparison with similar homes in the area
Home Values in the Area
Average Home Value in this Area
Purchase History
| Date | Buyer | Sale Price | Title Company |
|---|---|---|---|
| Lee Kyung M | $218,000 | Chicago Title Insurance Co | |
| Wickman David J | $170,100 | Nvr Title Agency Llc | |
| Nvr Inc | $36,600 | Attorney |
Source: Public Records
Mortgage History
| Date | Status | Borrower | Loan Amount |
|---|---|---|---|
| Open | Lee Kyung M | $163,500 | |
| Previous Owner | Wickman David J | $166,983 |
Source: Public Records
Tax History Compared to Growth
Tax History
| Year | Tax Paid | Tax Assessment Tax Assessment Total Assessment is a certain percentage of the fair market value that is determined by local assessors to be the total taxable value of land and additions on the property. | Land | Improvement |
|---|---|---|---|---|
| 2024 | -- | $102,780 | $22,420 | $80,360 |
| 2023 | $7,929 | $83,440 | $17,980 | $65,460 |
| 2022 | $4,286 | $83,440 | $17,980 | $65,460 |
| 2021 | $4,305 | $83,440 | $17,980 | $65,460 |
| 2020 | $4,229 | $72,550 | $15,630 | $56,920 |
| 2019 | $4,269 | $72,550 | $15,630 | $56,920 |
| 2018 | $4,103 | $56,570 | $10,780 | $45,790 |
| 2017 | $3,377 | $56,570 | $10,780 | $45,790 |
| 2016 | $3,104 | $56,570 | $10,780 | $45,790 |
| 2015 | $2,894 | $56,570 | $10,780 | $45,790 |
| 2014 | $2,948 | $56,570 | $10,780 | $45,790 |
| 2013 | $2,910 | $55,840 | $10,780 | $45,060 |
Source: Public Records
Map
Nearby Homes
- 1770 N Ashwood Ln
- 1997 Spruce Ln
- 1958 S Ashwood Ln
- 1714 W Jackson St
- 549 Walker Ln
- 1703 W Jackson St
- 384 Roberta Dr
- 0 W Jackson St Unit 5103770
- 0 W Jackson St Unit 5156332
- 433 Roberta Dr
- 401 Roberta Dr
- 180 Clairmont Dr
- 591 Cherrywood Ln
- 113 Palm Ct
- 146 Garfield Dr
- 6509 Hudson Ave
- 1651 Mentor Ave Unit 2008
- 1651 Mentor Ave Unit 2804
- 1651 Mentor Ave Unit 1706
- 1237 Crescent Dr
- 1805 N Ashwood Ln
- 1799 North Ashwood Dr
- 1799 N Ashwood Ln
- 1811 North Ashwood Dr
- 1811 N Ashwood Ln
- 1789 North Ashwood Dr
- 1821 North Ashwood Dr
- 1806 North Ashwood Dr
- 1779 North Ashwood Dr
- 1831 N Ashwood Ln
- 1800 North Ashwood Dr
- 1812 North Ashwood Dr
- 1812 N Ashwood Ln
- 1790 North Ashwood Dr
- 295 N Ashwood Ln
- 464 N Ashwood Ln
- 465 N Ashwood Ln
- 1769 North Ashwood Dr
- 1769 N Ashwood Ln
- 1839 N Ashwood Ln