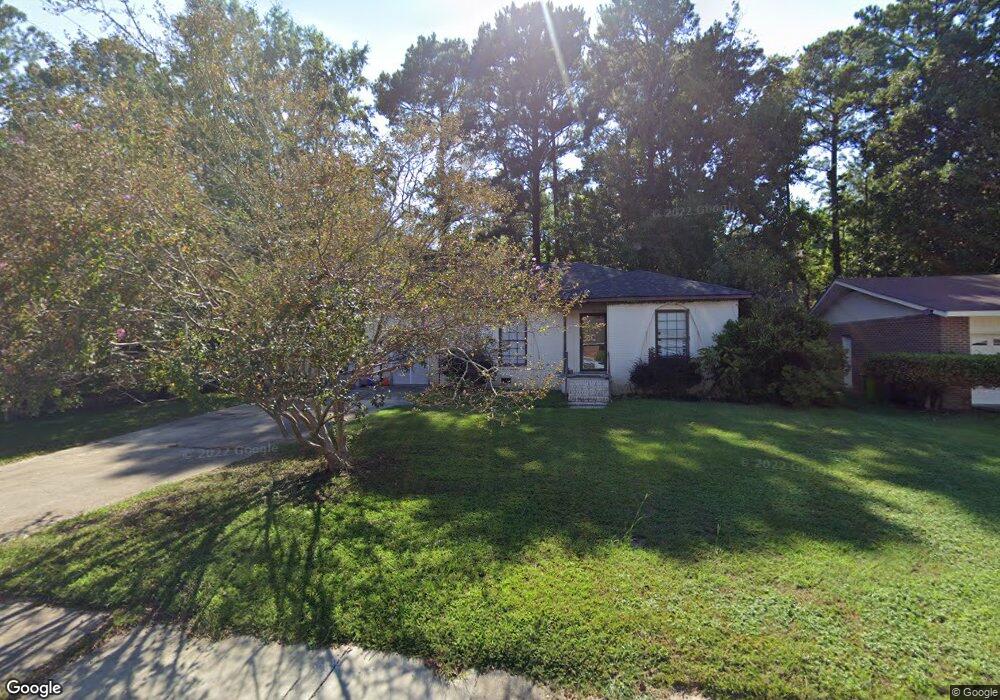
1805 Nunamaker Dr Columbia, SC 29210
Saint Andrews NeighborhoodEstimated Value: $202,847 - $247,000
3
Beds
2
Baths
2,156
Sq Ft
$104/Sq Ft
Est. Value
About This Home
This home is located at 1805 Nunamaker Dr, Columbia, SC 29210 and is currently estimated at $223,462, approximately $103 per square foot. 1805 Nunamaker Dr is a home located in Richland County with nearby schools including Sandel Elementary School, St. Andrews Middle School, and Columbia High School.
Ownership History
Date
Name
Owned For
Owner Type
Purchase Details
Closed on
Mar 18, 2018
Sold by
Huber Jennie L and Crider Jennie
Bought by
Crider Jennie and Crider Russell B
Current Estimated Value
Home Financials for this Owner
Home Financials are based on the most recent Mortgage that was taken out on this home.
Original Mortgage
$11,000
Outstanding Balance
$9,444
Interest Rate
4.46%
Mortgage Type
Credit Line Revolving
Estimated Equity
$214,018
Purchase Details
Closed on
Jun 14, 2007
Sold by
Jpmorgan Chase Bank
Bought by
Huber Jennie L
Home Financials for this Owner
Home Financials are based on the most recent Mortgage that was taken out on this home.
Original Mortgage
$80,000
Outstanding Balance
$48,713
Interest Rate
6.1%
Mortgage Type
Purchase Money Mortgage
Estimated Equity
$174,749
Purchase Details
Closed on
Oct 30, 2006
Sold by
Linnen Marion and Linnen Kim B
Bought by
Jp Morgan Chase Bank and Equity One Abs Inc Mortgage Pass Through
Create a Home Valuation Report for This Property
The Home Valuation Report is an in-depth analysis detailing your home's value as well as a comparison with similar homes in the area
Home Values in the Area
Average Home Value in this Area
Purchase History
| Date | Buyer | Sale Price | Title Company |
|---|---|---|---|
| Crider Jennie | -- | None Available | |
| Huber Jennie L | $80,000 | None Available | |
| Jp Morgan Chase Bank | $110,100 | None Available |
Source: Public Records
Mortgage History
| Date | Status | Borrower | Loan Amount |
|---|---|---|---|
| Open | Crider Jennie | $11,000 | |
| Open | Huber Jennie L | $80,000 |
Source: Public Records
Tax History Compared to Growth
Tax History
| Year | Tax Paid | Tax Assessment Tax Assessment Total Assessment is a certain percentage of the fair market value that is determined by local assessors to be the total taxable value of land and additions on the property. | Land | Improvement |
|---|---|---|---|---|
| 2024 | $1,210 | $122,900 | $0 | $0 |
| 2023 | $1,161 | $4,276 | $0 | $0 |
| 2022 | $1,054 | $106,900 | $12,800 | $94,100 |
| 2021 | $1,049 | $4,280 | $0 | $0 |
| 2020 | $3,218 | $6,410 | $0 | $0 |
| 2019 | $3,195 | $6,410 | $0 | $0 |
| 2018 | $939 | $3,840 | $0 | $0 |
| 2017 | $920 | $3,840 | $0 | $0 |
| 2016 | $916 | $3,840 | $0 | $0 |
| 2015 | $893 | $3,840 | $0 | $0 |
| 2014 | $869 | $96,100 | $0 | $0 |
| 2013 | -- | $3,840 | $0 | $0 |
Source: Public Records
Map
Nearby Homes
- 1917 Chandler Ave
- 2006 Mary Hill Dr
- 1917 Kathleen Dr
- 2116 Chandler Ave
- 2229 Hertford Dr
- 2225 Hertford Dr
- 1904 Elise Dr
- 2717 Diane Dr
- 2103 Marley Dr
- 2214 Rolling Hills Rd
- 1509 Nunamaker Dr
- 1605 Kathleen Dr
- 2135 Rolling Hills Rd
- 1825 Woodsboro Dr
- 529 Cambout St
- 1810 Saint Michaels Rd
- 1533 Westchester Dr
- 1913 Grays Inn Rd
- 1900 Rolling Hills Rd
- 321 Cambout St
- 1809 Nunamaker Dr
- 1804 Hi Sierra Dr
- 1913 Chandler Ave
- 1808 Hi Sierra Dr
- 1813 Nunamaker Dr
- 1804 Nunamaker Dr
- 2001 Chandler Ave
- 1920 Chandler Ave
- 1808 Nunamaker Dr
- 1812 Hi Sierra Dr
- 1817 Nunamaker Dr
- 1812 Nunamaker Dr
- 1709 Nunamaker Dr
- 2000 Chandler Ave
- 1916 Chandler Ave
- 2005 Chandler Ave
- 1816 Hi Sierra Dr
- 1805 Hi Sierra Dr
- 1809 Hi Sierra Dr
- 1905 Chandler Ave