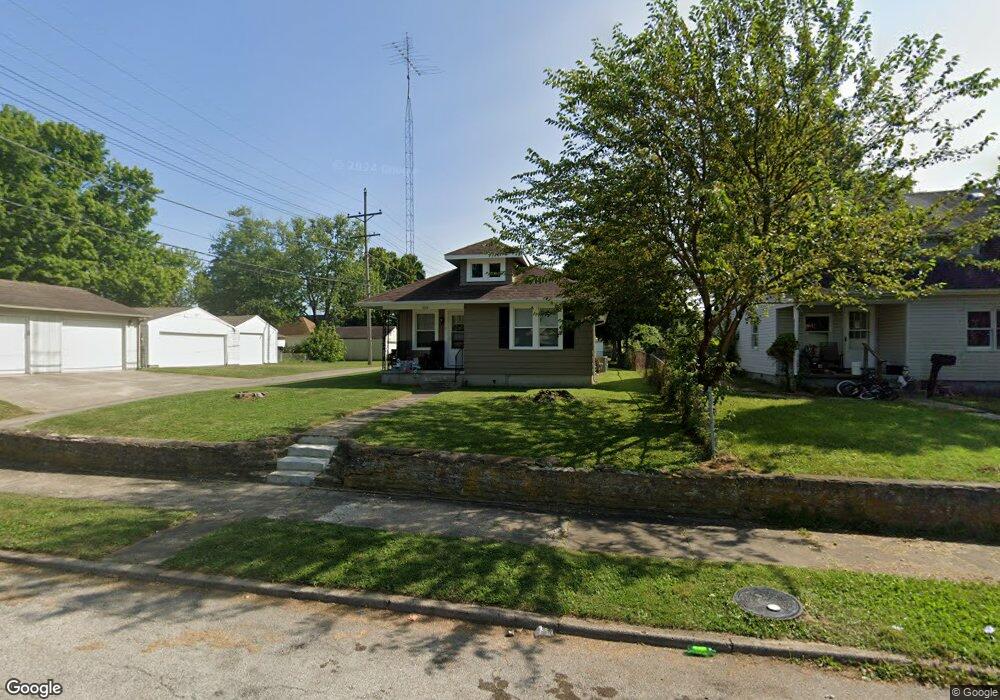
1805 NW C St Richmond, IN 47374
Estimated Value: $104,000 - $112,000
2
Beds
1
Bath
910
Sq Ft
$119/Sq Ft
Est. Value
About This Home
This home is located at 1805 NW C St, Richmond, IN 47374 and is currently estimated at $108,290, approximately $119 per square foot. 1805 NW C St is a home located in Wayne County with nearby schools including Westview Elementary School, Dennis Middle School, and Richmond High School.
Ownership History
Date
Name
Owned For
Owner Type
Purchase Details
Closed on
Jul 24, 2023
Sold by
Gibbel Michael P and Gibbel Cindy Kay
Bought by
Doerflein Racheal Leigh-Ann
Current Estimated Value
Home Financials for this Owner
Home Financials are based on the most recent Mortgage that was taken out on this home.
Original Mortgage
$79,622
Outstanding Balance
$77,694
Interest Rate
6.71%
Mortgage Type
New Conventional
Estimated Equity
$30,596
Purchase Details
Closed on
Dec 4, 2008
Sold by
Deutsch Bank National Trust Company
Bought by
Gibbel Michael P and Gibbel Cindy Kay
Purchase Details
Closed on
Oct 22, 2008
Sold by
Amick David A
Bought by
Deutsche Bank National Trust Co
Create a Home Valuation Report for This Property
The Home Valuation Report is an in-depth analysis detailing your home's value as well as a comparison with similar homes in the area
Home Values in the Area
Average Home Value in this Area
Purchase History
| Date | Buyer | Sale Price | Title Company |
|---|---|---|---|
| Doerflein Racheal Leigh-Ann | -- | None Listed On Document | |
| Gibbel Michael P | -- | -- | |
| Deutsche Bank National Trust Co | $65,282 | -- |
Source: Public Records
Mortgage History
| Date | Status | Borrower | Loan Amount |
|---|---|---|---|
| Open | Doerflein Racheal Leigh-Ann | $79,622 |
Source: Public Records
Tax History Compared to Growth
Tax History
| Year | Tax Paid | Tax Assessment Tax Assessment Total Assessment is a certain percentage of the fair market value that is determined by local assessors to be the total taxable value of land and additions on the property. | Land | Improvement |
|---|---|---|---|---|
| 2024 | $670 | $67,000 | $13,900 | $53,100 |
| 2023 | $371 | $37,100 | $12,200 | $24,900 |
| 2022 | $752 | $37,600 | $12,200 | $25,400 |
| 2021 | $728 | $36,400 | $12,200 | $24,200 |
| 2020 | $728 | $36,400 | $12,200 | $24,200 |
| 2019 | $722 | $36,100 | $12,200 | $23,900 |
| 2018 | $722 | $36,100 | $12,200 | $23,900 |
| 2017 | $724 | $36,200 | $12,200 | $24,000 |
| 2016 | $726 | $36,300 | $12,200 | $24,100 |
| 2014 | $684 | $34,200 | $12,200 | $22,000 |
| 2013 | $684 | $32,500 | $12,200 | $20,300 |
Source: Public Records
Map
Nearby Homes