Estimated Value: $214,000 - $235,000
3
Beds
2
Baths
1,422
Sq Ft
$158/Sq Ft
Est. Value
About This Home
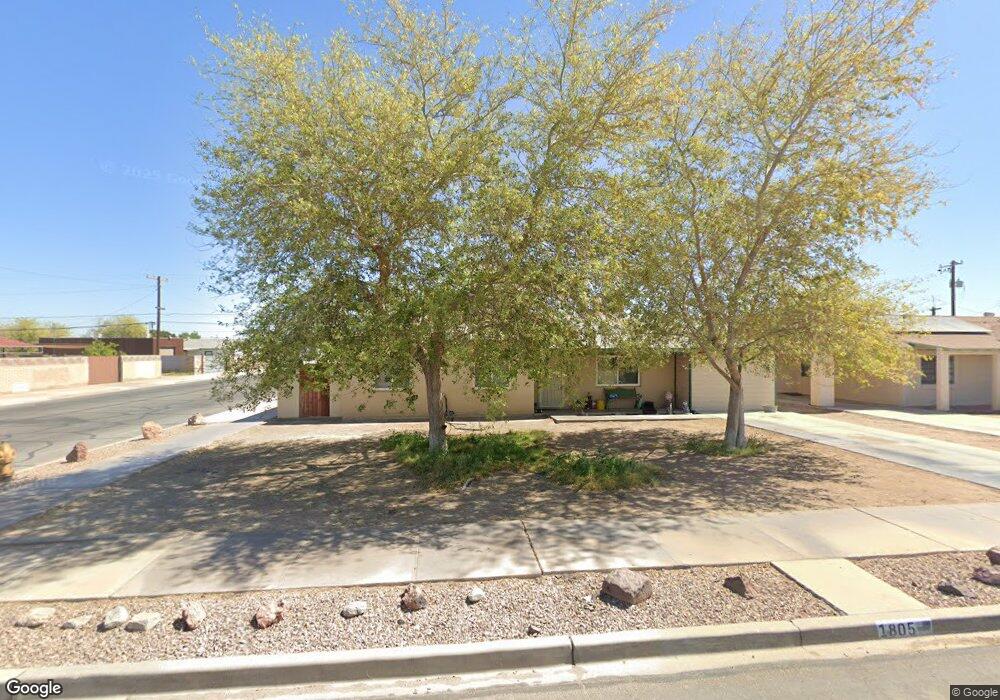
This home is located at 1805 S 10th Ave, Yuma, AZ 85364 and is currently estimated at $225,374, approximately $158 per square foot. 1805 S 10th Ave is a home located in Yuma County with nearby schools including Alice Byrne Elementary School, R. Pete Woodard Junior High School, and Yuma High School.
Ownership History
Date
Name
Owned For
Owner Type
Purchase Details
Closed on
Aug 10, 2023
Sold by
Denise Aaron Joshua
Bought by
Aaron J Denise Living Trust and Denise
Current Estimated Value
Purchase Details
Closed on
Sep 24, 2013
Sold by
Denise Aaron Joshua
Bought by
Denise Aaron Joshua and Denise Chelsea L
Home Financials for this Owner
Home Financials are based on the most recent Mortgage that was taken out on this home.
Original Mortgage
$80,000
Interest Rate
4.46%
Mortgage Type
New Conventional
Purchase Details
Closed on
Nov 20, 2008
Sold by
Dora John M and Dora Judythe
Bought by
Denise Aaron Joshua
Home Financials for this Owner
Home Financials are based on the most recent Mortgage that was taken out on this home.
Original Mortgage
$88,800
Interest Rate
5.9%
Mortgage Type
Seller Take Back
Purchase Details
Closed on
Oct 23, 2003
Sold by
Dora John M and Dora Judythe A
Bought by
Dora John M and Dora Judythe A
Create a Home Valuation Report for This Property
The Home Valuation Report is an in-depth analysis detailing your home's value as well as a comparison with similar homes in the area
Purchase History
| Date | Buyer | Sale Price | Title Company |
|---|---|---|---|
| Aaron J Denise Living Trust | -- | None Listed On Document | |
| Denise Aaron Joshua | -- | Pioneer Title Agency Inc | |
| Denise Aaron Joshua | $98,800 | Chicago Title | |
| Dora John M | -- | -- |
Source: Public Records
Mortgage History
| Date | Status | Borrower | Loan Amount |
|---|---|---|---|
| Previous Owner | Denise Aaron Joshua | $80,000 | |
| Previous Owner | Denise Aaron Joshua | $88,800 |
Source: Public Records
Tax History
| Year | Tax Paid | Tax Assessment Tax Assessment Total Assessment is a certain percentage of the fair market value that is determined by local assessors to be the total taxable value of land and additions on the property. | Land | Improvement |
|---|---|---|---|---|
| 2025 | $1,276 | $12,729 | $2,731 | $9,998 |
| 2024 | $1,253 | $12,123 | $2,484 | $9,639 |
| 2023 | $1,253 | $11,547 | $2,388 | $9,159 |
| 2019 | $1,151 | $9,499 | $2,198 | $7,301 |
Source: Public Records
Map
Nearby Homes
- 1845 S 9th Ave
- 1635 S 10th Ave
- 1995 S 10th Ave
- 1913 S 6th Ave
- 605 W 20th St
- 1525 S 9th Ave
- 500 W 20th St
- 1307 W Ridgeview Dr
- 0000 S Avenue A
- 2063 S 6th Ave
- 1245 W 20th Place
- 2045 S 14th Ave
- 2104 S 11th Ave
- 905 W 21st St
- 2150 S Ave a
- 1409 S 13th Ave
- 1406 W Camino Real
- 2193 S 6th Ave
- 1925 S Ridgeview Dr
- 1330 S 10th Ave
- 1815 S 10th Ave
- 1825 S 10th Ave
- 1737 S 10th Ave
- 1800 S 9th Ave
- 1810 S 9th Ave
- 1733 S 10th Ave
- 1800 S 10th Ave
- 1820 S 9th Ave
- 1740 S 9th Ave
- 1810 S 10th Ave
- 1820 S 10th Ave
- 1742 S 10th Ave
- 1830 S 9th Ave
- 1734 S 9th Ave
- 1845 S 10th Ave
- 1729 S 10th Ave
- 1830 S 10th Ave
- 1738 S 10th Ave
- 1840 S 9th Ave
- 1730 S 9th Ave
Your Personal Tour Guide
Ask me questions while you tour the home.