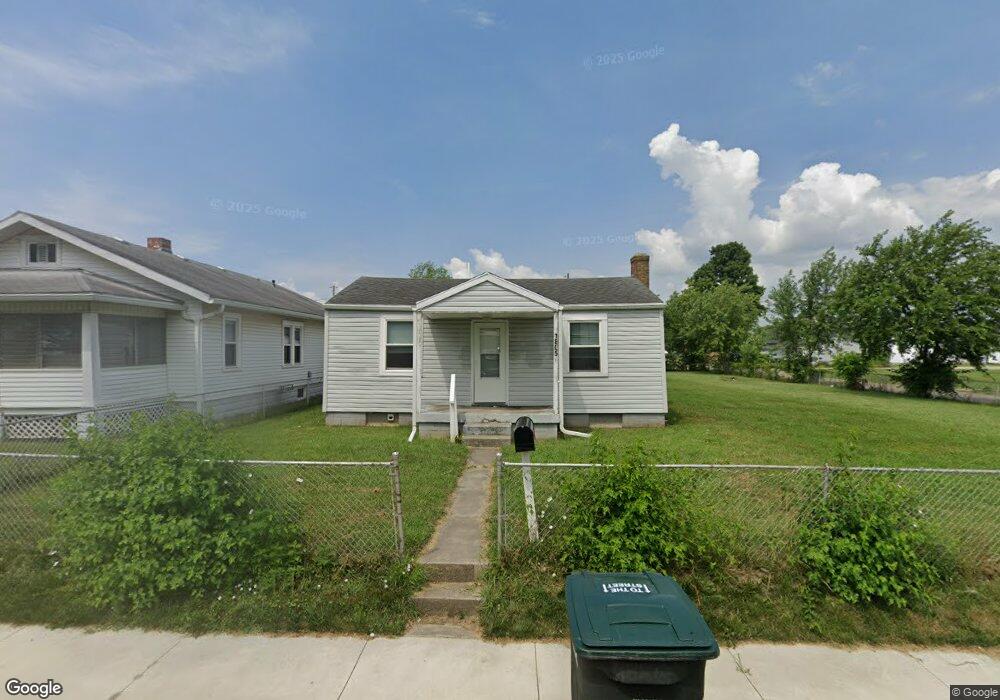
1805 S Franklin St Muncie, IN 47302
South Central NeighborhoodEstimated Value: $51,000 - $94,000
2
Beds
2
Baths
896
Sq Ft
$76/Sq Ft
Est. Value
About This Home
This home is located at 1805 S Franklin St, Muncie, IN 47302 and is currently estimated at $67,768, approximately $75 per square foot. 1805 S Franklin St is a home located in Delaware County with nearby schools including South View Elementary School, Muncie Central High School, and Southside Middle School.
Ownership History
Date
Name
Owned For
Owner Type
Purchase Details
Closed on
Jun 30, 2022
Sold by
Labrador Investments Llc
Bought by
Indy Flipper Llc
Current Estimated Value
Purchase Details
Closed on
Aug 30, 2014
Sold by
Delancey Brett
Bought by
Corporate Leasing Llc
Purchase Details
Closed on
Apr 30, 2013
Sold by
Old National Bank
Bought by
Delancey Brett
Purchase Details
Closed on
Oct 10, 2012
Sold by
Double J Ranch Llc
Bought by
Old National Bank
Purchase Details
Closed on
Sep 12, 2008
Sold by
Ranch Double J
Bought by
Double J Ranch Llc
Home Financials for this Owner
Home Financials are based on the most recent Mortgage that was taken out on this home.
Original Mortgage
$84,147
Interest Rate
6.57%
Mortgage Type
Future Advance Clause Open End Mortgage
Purchase Details
Closed on
Mar 31, 2008
Sold by
M Jewell Llc and Terry Tom
Bought by
Ranch Double J
Purchase Details
Closed on
Jan 10, 2008
Sold by
Chalfant Joyce
Bought by
M Jewell Llc
Create a Home Valuation Report for This Property
The Home Valuation Report is an in-depth analysis detailing your home's value as well as a comparison with similar homes in the area
Home Values in the Area
Average Home Value in this Area
Purchase History
| Date | Buyer | Sale Price | Title Company |
|---|---|---|---|
| Indy Flipper Llc | -- | Investors Title | |
| Labrador Investments Llc | -- | Investors Title | |
| Corporate Leasing Llc | -- | -- | |
| Delancey Brett | -- | -- | |
| Old National Bank | $117,000 | None Available | |
| Double J Ranch Llc | -- | None Available | |
| Ranch Double J | -- | None Available | |
| M Jewell Llc | -- | None Available |
Source: Public Records
Mortgage History
| Date | Status | Borrower | Loan Amount |
|---|---|---|---|
| Previous Owner | Double J Ranch Llc | $84,147 |
Source: Public Records
Tax History Compared to Growth
Tax History
| Year | Tax Paid | Tax Assessment Tax Assessment Total Assessment is a certain percentage of the fair market value that is determined by local assessors to be the total taxable value of land and additions on the property. | Land | Improvement |
|---|---|---|---|---|
| 2024 | $886 | $38,900 | $6,600 | $32,300 |
| 2023 | $1,823 | $32,000 | $6,600 | $25,400 |
| 2022 | $752 | $32,200 | $6,600 | $25,600 |
| 2021 | $584 | $23,800 | $7,100 | $16,700 |
| 2020 | $512 | $20,200 | $6,200 | $14,000 |
| 2019 | $512 | $20,200 | $6,200 | $14,000 |
| 2018 | $566 | $20,200 | $6,200 | $14,000 |
| 2017 | $480 | $18,600 | $6,200 | $12,400 |
| 2016 | $508 | $20,000 | $6,900 | $13,100 |
| 2014 | $495 | $22,600 | $8,600 | $14,000 |
| 2013 | -- | $21,800 | $8,600 | $13,200 |
Source: Public Records
Map
Nearby Homes
- 1702 S High St
- 1911 S Walnut St
- 514 W Memorial Dr
- 605 W 10th St
- 2004 S Walnut St
- 2101 S Mulberry St
- 706 W 11th St
- 208 E 8th St
- 1303 S Liberty St
- 218 E 8th St
- 429 W 6th St
- 802 W 13th St
- 1715 S Madison St
- 221 E 6th St
- 2316 S Walnut St
- 226 E 16th St
- 1325 S Hoyt Ave
- 2307 S Jefferson St
- 1014 W 10th St
- 1710 S Birch St
- 1811 S Franklin St
- 301 W 11th St
- 1725 S Franklin St
- 1717 S Franklin St
- 1802 S Liberty St
- 1804 S Liberty St
- 1800 S Liberty St
- 1804 S Franklin St
- 1800 S Franklin St
- 1810 S Franklin St
- 1810 S Liberty St
- 312 W Memorial Dr
- 1713 S Franklin St
- 1814 S Franklin St
- 1818 S Franklin St
- 316 W Memorial Dr
- 1718 S Liberty St
- 1724 S Franklin St
- 320 W Memorial Dr
- 1716 S Liberty St