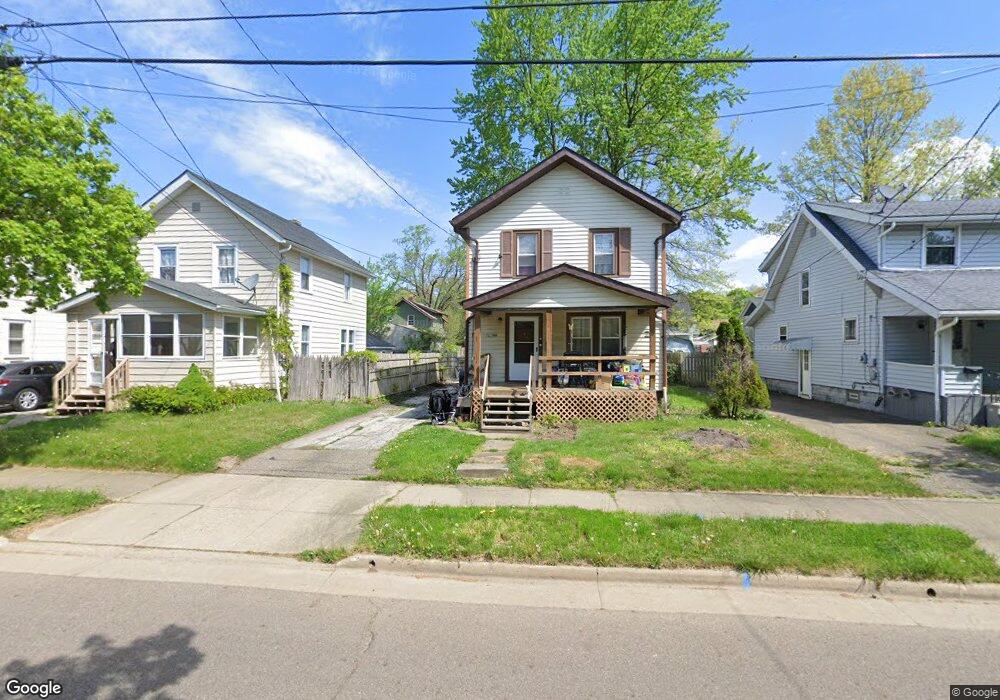
1805 Shaw Ave Akron, OH 44305
Goodyear Heights NeighborhoodEstimated Value: $93,000 - $134,000
3
Beds
1
Bath
1,280
Sq Ft
$89/Sq Ft
Est. Value
About This Home
This home is located at 1805 Shaw Ave, Akron, OH 44305 and is currently estimated at $114,313, approximately $89 per square foot. 1805 Shaw Ave is a home located in Summit County with nearby schools including Seiberling Community Learning Center, Akron Preparatory school, and Middlebury Academy.
Ownership History
Date
Name
Owned For
Owner Type
Purchase Details
Closed on
Sep 15, 2023
Sold by
Specialized Ira Services
Bought by
Aviman Llc
Current Estimated Value
Purchase Details
Closed on
Mar 14, 2019
Sold by
Semgen Holdings Llc
Bought by
Specialized Ira Services and David Humphrey Ira
Purchase Details
Closed on
Oct 11, 2018
Sold by
Adair Holdings Llc
Bought by
Semgen Holdings Llc
Purchase Details
Closed on
Mar 5, 2018
Sold by
Adair Asset Management Llc
Bought by
Londrico Louis J
Home Financials for this Owner
Home Financials are based on the most recent Mortgage that was taken out on this home.
Original Mortgage
$132,000
Interest Rate
4.04%
Mortgage Type
New Conventional
Purchase Details
Closed on
Feb 28, 1997
Sold by
Arlene Stokes Trst
Bought by
Woods Amanda
Home Financials for this Owner
Home Financials are based on the most recent Mortgage that was taken out on this home.
Original Mortgage
$58,950
Interest Rate
7.93%
Mortgage Type
Balloon
Create a Home Valuation Report for This Property
The Home Valuation Report is an in-depth analysis detailing your home's value as well as a comparison with similar homes in the area
Home Values in the Area
Average Home Value in this Area
Purchase History
| Date | Buyer | Sale Price | Title Company |
|---|---|---|---|
| Aviman Llc | $75,000 | Title Select | |
| Specialized Ira Services | $53,900 | None Available | |
| Semgen Holdings Llc | $17,000 | First American Title Ins Co | |
| Londrico Louis J | -- | None Available | |
| Woods Amanda | $53,900 | -- |
Source: Public Records
Mortgage History
| Date | Status | Borrower | Loan Amount |
|---|---|---|---|
| Previous Owner | Londrico Louis J | $132,000 | |
| Previous Owner | Woods Amanda | $58,950 |
Source: Public Records
Tax History
| Year | Tax Paid | Tax Assessment Tax Assessment Total Assessment is a certain percentage of the fair market value that is determined by local assessors to be the total taxable value of land and additions on the property. | Land | Improvement |
|---|---|---|---|---|
| 2025 | $1,822 | $30,482 | $6,759 | $23,723 |
| 2024 | $1,735 | $30,482 | $6,759 | $23,723 |
| 2023 | $1,822 | $30,482 | $6,759 | $23,723 |
| 2022 | $1,510 | $20,598 | $4,568 | $16,030 |
| 2021 | $1,512 | $20,598 | $4,568 | $16,030 |
| 2020 | $1,491 | $20,600 | $4,570 | $16,030 |
| 2019 | $1,489 | $18,690 | $4,760 | $13,930 |
| 2018 | $1,376 | $18,690 | $4,760 | $13,930 |
| 2017 | $1,398 | $18,690 | $4,760 | $13,930 |
| 2016 | $1,399 | $18,690 | $4,760 | $13,930 |
| 2015 | $1,398 | $18,690 | $4,760 | $13,930 |
| 2014 | $1,387 | $18,690 | $4,760 | $13,930 |
| 2013 | $1,306 | $17,920 | $4,760 | $13,160 |
Source: Public Records
Map
Nearby Homes
- 204 Morningview Ave
- 1603 Hampton Rd
- 1584 Hampton Rd
- 250 Morningview Ave
- 1874 Adelaide Blvd
- 1820 Malasia Rd
- 1551 Preston Ave
- 1578 Pilgrim St
- 1591 Pilgrim St
- 248 Malacca St
- 153 Cutler Pkwy
- 1529 Pilgrim St
- 291 Malacca St
- 1516 Newton St
- 295 Goodview Ave
- 1438 Newton St
- 191 Colony Crescent
- 310 Vaniman St
- 425 Frazier Ave
- 20 Verdun Dr
Your Personal Tour Guide
Ask me questions while you tour the home.