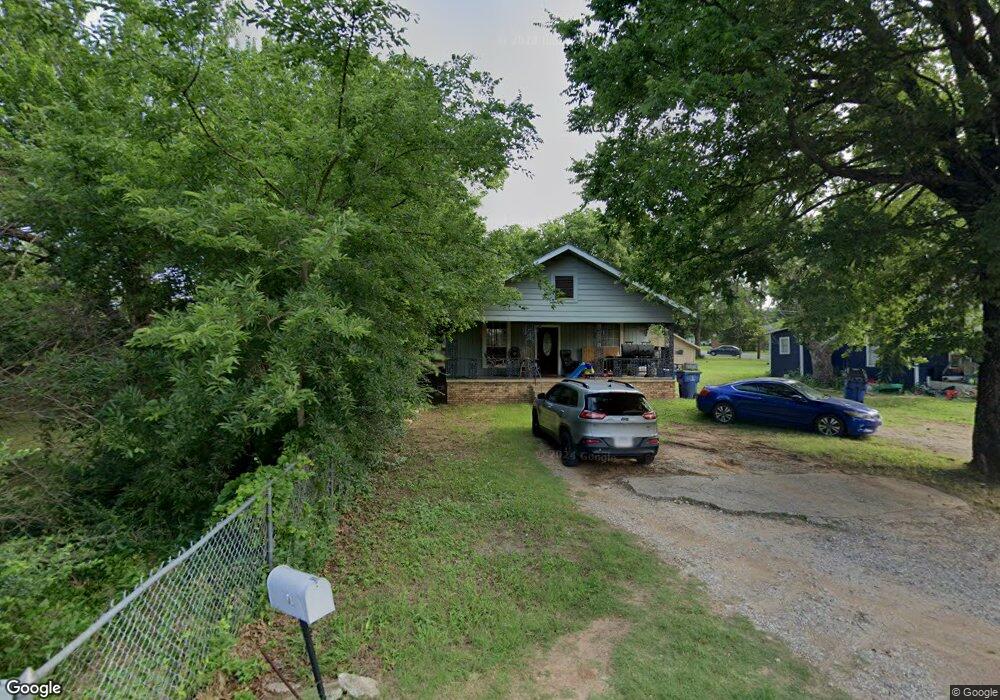
1805 W Bond St Denison, TX 75020
Estimated Value: $154,935 - $188,000
3
Beds
2
Baths
1,372
Sq Ft
$125/Sq Ft
Est. Value
About This Home
This home is located at 1805 W Bond St, Denison, TX 75020 and is currently estimated at $171,468, approximately $124 per square foot. 1805 W Bond St is a home located in Grayson County with nearby schools including Mayes Elementary School, Scott Middle School, and Denison High School.
Ownership History
Date
Name
Owned For
Owner Type
Purchase Details
Closed on
Apr 9, 2019
Sold by
Russell Tyrel Cunningham Irrevocable Tr
Bought by
Cunningham Russell Tyrel
Current Estimated Value
Purchase Details
Closed on
Feb 8, 2008
Sold by
Cunningham Russell Tyrel
Bought by
Russell Tyrel Cunningham Irrevocable Tr
Purchase Details
Closed on
Nov 30, 2007
Sold by
Cunningham Levi Daniel and Cunningham Shannon D
Bought by
Cunningham Russell Tyrel
Purchase Details
Closed on
Oct 20, 2004
Sold by
Franklin Luva Lynn Lopez
Bought by
Cunningham Levi Daniel and Cunningham Shannon D
Home Financials for this Owner
Home Financials are based on the most recent Mortgage that was taken out on this home.
Original Mortgage
$32,480
Interest Rate
5.82%
Mortgage Type
FHA
Create a Home Valuation Report for This Property
The Home Valuation Report is an in-depth analysis detailing your home's value as well as a comparison with similar homes in the area
Home Values in the Area
Average Home Value in this Area
Purchase History
| Date | Buyer | Sale Price | Title Company |
|---|---|---|---|
| Cunningham Russell Tyrel | -- | None Available | |
| Russell Tyrel Cunningham Irrevocable Tr | -- | None Available | |
| Cunningham Russell Tyrel | -- | Grayson County Title | |
| Cunningham Levi Daniel | -- | -- |
Source: Public Records
Mortgage History
| Date | Status | Borrower | Loan Amount |
|---|---|---|---|
| Previous Owner | Cunningham Levi Daniel | $32,480 |
Source: Public Records
Tax History Compared to Growth
Tax History
| Year | Tax Paid | Tax Assessment Tax Assessment Total Assessment is a certain percentage of the fair market value that is determined by local assessors to be the total taxable value of land and additions on the property. | Land | Improvement |
|---|---|---|---|---|
| 2025 | $1,153 | $112,903 | -- | -- |
| 2024 | $2,385 | $102,639 | $0 | $0 |
| 2023 | $965 | $93,308 | $0 | $0 |
| 2022 | $2,015 | $84,825 | $0 | $0 |
| 2021 | $1,945 | $77,114 | $10,152 | $66,962 |
| 2020 | $1,953 | $74,040 | $6,883 | $67,157 |
| 2019 | $2,101 | $76,354 | $5,988 | $70,366 |
| 2018 | $2,060 | $74,253 | $3,536 | $70,717 |
| 2017 | $1,956 | $69,906 | $3,162 | $66,744 |
| 2016 | $2,066 | $73,848 | $1,938 | $71,910 |
| 2015 | $1,790 | $63,354 | $1,632 | $61,722 |
| 2014 | $1,632 | $57,782 | $1,632 | $56,150 |
Source: Public Records
Map
Nearby Homes
- 1721 W Walker St Unit A and B
- 1905 W Morton St Unit 6
- 1905 W Morton St Unit 5
- 1905 W Morton St Unit 17
- 1905 W Morton St Unit 20
- 1905 W Morton St Unit 7
- 1915 W Bond St
- 1601 W Bond St
- 1985 W Bond St
- 2900 W Morton St
- 3130 W Morton St
- 3030 W Morton St
- 1700 W Morton St
- 3300 W Morton St
- 916 Leeper Dr
- 2021 W Walker St
- 1505 W Johnson St
- 2112 W Bond St
- 1609 W Woodard St
- TBD - W Washington St
- 1731 W Bond St
- 1800 W Walker St
- 1800 W Bond St
- 1901 Juanita Dr
- 1814 W Bond St
- 1730 W Walker St
- 1809 W Bond St
- 1730 W Bond St
- 1725 W Bond St
- 701 N Derby St
- 1818 W Bond St
- 1728 W Bond St
- 1722 W Walker St
- 1723 W Bond St
- 705 N Derby St
- 1822 W Bond St
- 1720 W Walker St
- 1719 W Bond St
- 1801 W Morton St
- 1720 W Bond St