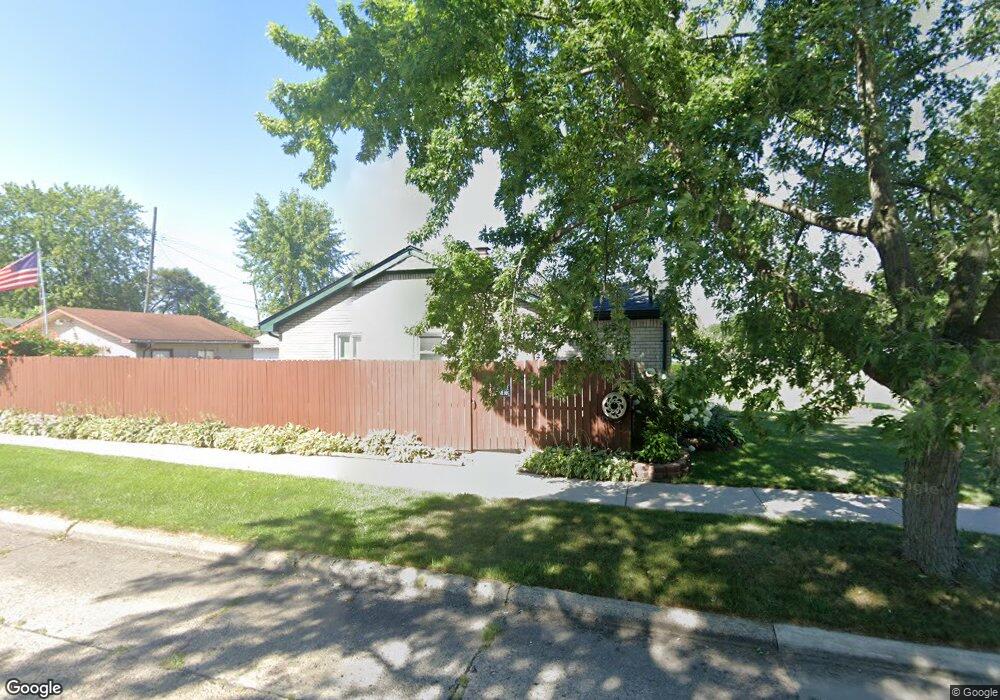
18054 Stephens Dr Eastpointe, MI 48021
Estimated Value: $122,000 - $154,000
Studio
1
Bath
1,000
Sq Ft
$139/Sq Ft
Est. Value
About This Home
This home is located at 18054 Stephens Dr, Eastpointe, MI 48021 and is currently estimated at $138,992, approximately $138 per square foot. 18054 Stephens Dr is a home located in Macomb County with nearby schools including Forest Park Elementary School, Eastpointe Middle School, and Reach Charter Academy.
Ownership History
Date
Name
Owned For
Owner Type
Purchase Details
Closed on
Apr 19, 2025
Sold by
Campbell James T and Campbell Linda
Bought by
Campbell James T and Campbell Linda
Current Estimated Value
Purchase Details
Closed on
Apr 18, 2025
Sold by
Campbell James T and Campbell Linda
Bought by
Campbell James T and Campbell Linda
Purchase Details
Closed on
Apr 17, 2006
Sold by
Fannie Mae
Bought by
Campbell James T
Home Financials for this Owner
Home Financials are based on the most recent Mortgage that was taken out on this home.
Original Mortgage
$62,400
Interest Rate
6.42%
Mortgage Type
New Conventional
Purchase Details
Closed on
Jan 24, 2005
Sold by
Indymac Bank Fsb
Bought by
Federal National Mortgage Association
Purchase Details
Closed on
Jan 21, 2005
Sold by
Naidus Michael and Macneill Stephanie L
Bought by
Indymac Bank Fsb
Purchase Details
Closed on
Jun 4, 2001
Sold by
Pomaville George P
Bought by
Naidus Michael
Purchase Details
Closed on
Oct 18, 1995
Sold by
Fackler R and Fackler L
Bought by
Pomaville G
Create a Home Valuation Report for This Property
The Home Valuation Report is an in-depth analysis detailing your home's value as well as a comparison with similar homes in the area
Home Values in the Area
Average Home Value in this Area
Purchase History
| Date | Buyer | Sale Price | Title Company |
|---|---|---|---|
| Campbell James T | -- | None Listed On Document | |
| Campbell James T | -- | None Listed On Document | |
| Campbell James T | $78,000 | Glt | |
| Federal National Mortgage Association | -- | -- | |
| Indymac Bank Fsb | $113,862 | -- | |
| Naidus Michael | $104,000 | -- | |
| Pomaville G | $69,900 | -- |
Source: Public Records
Mortgage History
| Date | Status | Borrower | Loan Amount |
|---|---|---|---|
| Previous Owner | Campbell James T | $62,400 |
Source: Public Records
Tax History
| Year | Tax Paid | Tax Assessment Tax Assessment Total Assessment is a certain percentage of the fair market value that is determined by local assessors to be the total taxable value of land and additions on the property. | Land | Improvement |
|---|---|---|---|---|
| 2025 | $1,789 | $64,300 | $0 | $0 |
| 2024 | $17 | $62,200 | $0 | $0 |
| 2023 | $1,674 | $53,900 | $0 | $0 |
| 2022 | $1,740 | $48,900 | $0 | $0 |
| 2021 | $1,713 | $43,400 | $0 | $0 |
| 2020 | $1,637 | $37,400 | $0 | $0 |
| 2019 | $1,633 | $30,800 | $0 | $0 |
| 2018 | $1,681 | $28,630 | $0 | $0 |
| 2017 | $1,555 | $26,120 | $2,750 | $23,370 |
| 2016 | $1,542 | $26,120 | $0 | $0 |
| 2015 | $1,123 | $24,780 | $0 | $0 |
| 2013 | -- | $23,430 | $0 | $0 |
Source: Public Records
Map
Nearby Homes
- 23708 Lexington Ave
- 23856 Normandy Ave
- 23728 Normandy Ave
- 23809 Normandy Ave
- 23328 Lexington Ave
- 24287 Teppert Ave
- 24268 Brittany Ave
- 23824 Tuscany Ave
- 18429 Stephens Rd
- 23089 Brittany Ave
- 24572 Rosalind Ave
- 23754 Lambrecht Ave
- 23011 Normandy Ave
- 24336 Warrington Ct
- 24552 Tuscany Ave
- 24500 Lambrecht Ave
- 22785 Schroeder Ave
- 22765 Rosalind Ave
- 22789 Normandy Ave
- 23018 Lambrecht Ave
- 18046 Stephens Dr
- 18118 Stephens Dr
- 23837 Lexington Ave Unit Bldg-Unit
- 23837 Lexington Ave
- 18038 Stephens Dr
- 18030 Stephens Dr
- 18126 Stephens Dr Unit Bldg-Unit
- 18126 Stephens Dr
- 23829 Lexington Ave
- 23836 Lexington Ave
- 18134 Stephens Dr
- 18022 Stephens Dr
- 23821 Lexington Ave
- 18014 Stephens Dr
- 18049 Stephens Dr
- 23838 Wilmot Ave
- 18105 Stephens Dr
- 18142 Stephens Dr
- 18115 Stephens Dr
- 23828 Lexington Ave
Your Personal Tour Guide
Ask me questions while you tour the home.