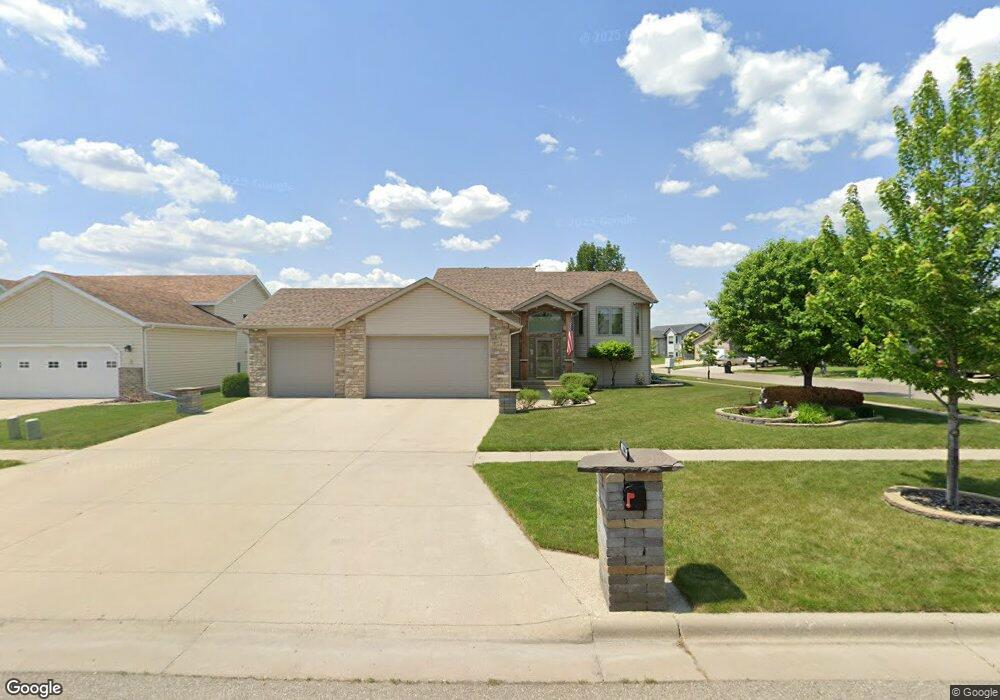
1806 7th St W West Fargo, ND 58078
Elmwood Court NeighborhoodEstimated Value: $324,000 - $456,009
4
Beds
2
Baths
2,390
Sq Ft
$163/Sq Ft
Est. Value
About This Home
This home is located at 1806 7th St W, West Fargo, ND 58078 and is currently estimated at $390,005, approximately $163 per square foot. 1806 7th St W is a home located in Cass County with nearby schools including Westside Elementary School, Cheney Middle School, and West Fargo High School.
Ownership History
Date
Name
Owned For
Owner Type
Purchase Details
Closed on
Mar 2, 2009
Sold by
Haugen Matthew D and Haugen Duane R
Bought by
Randall Alan J and Randall Sheila M
Current Estimated Value
Purchase Details
Closed on
Jan 20, 2006
Sold by
Sdb Construction Inc
Bought by
Haugen Matthew D and Haugen Duane R
Home Financials for this Owner
Home Financials are based on the most recent Mortgage that was taken out on this home.
Original Mortgage
$150,342
Interest Rate
6.46%
Mortgage Type
New Conventional
Purchase Details
Closed on
Nov 17, 2005
Sold by
Classic Construction Inc
Bought by
Sbd Construction Inc
Create a Home Valuation Report for This Property
The Home Valuation Report is an in-depth analysis detailing your home's value as well as a comparison with similar homes in the area
Home Values in the Area
Average Home Value in this Area
Purchase History
| Date | Buyer | Sale Price | Title Company |
|---|---|---|---|
| Randall Alan J | -- | -- | |
| Haugen Matthew D | -- | -- | |
| Sbd Construction Inc | -- | -- |
Source: Public Records
Mortgage History
| Date | Status | Borrower | Loan Amount |
|---|---|---|---|
| Previous Owner | Haugen Matthew D | $150,342 |
Source: Public Records
Tax History Compared to Growth
Tax History
| Year | Tax Paid | Tax Assessment Tax Assessment Total Assessment is a certain percentage of the fair market value that is determined by local assessors to be the total taxable value of land and additions on the property. | Land | Improvement |
|---|---|---|---|---|
| 2024 | $4,248 | $162,850 | $28,100 | $134,750 |
| 2023 | $4,678 | $159,550 | $28,100 | $131,450 |
| 2022 | $4,603 | $150,350 | $28,100 | $122,250 |
| 2021 | $4,542 | $139,400 | $22,450 | $116,950 |
| 2020 | $4,372 | $137,200 | $22,450 | $114,750 |
| 2019 | $4,147 | $133,650 | $22,450 | $111,200 |
| 2018 | $4,429 | $134,850 | $22,450 | $112,400 |
| 2017 | $5,173 | $134,950 | $22,450 | $112,500 |
| 2016 | $4,812 | $131,650 | $22,450 | $109,200 |
| 2015 | $4,678 | $113,450 | $15,400 | $98,050 |
| 2014 | $4,677 | $106,050 | $15,400 | $90,650 |
| 2013 | $4,587 | $103,400 | $15,400 | $88,000 |
Source: Public Records
Map
Nearby Homes