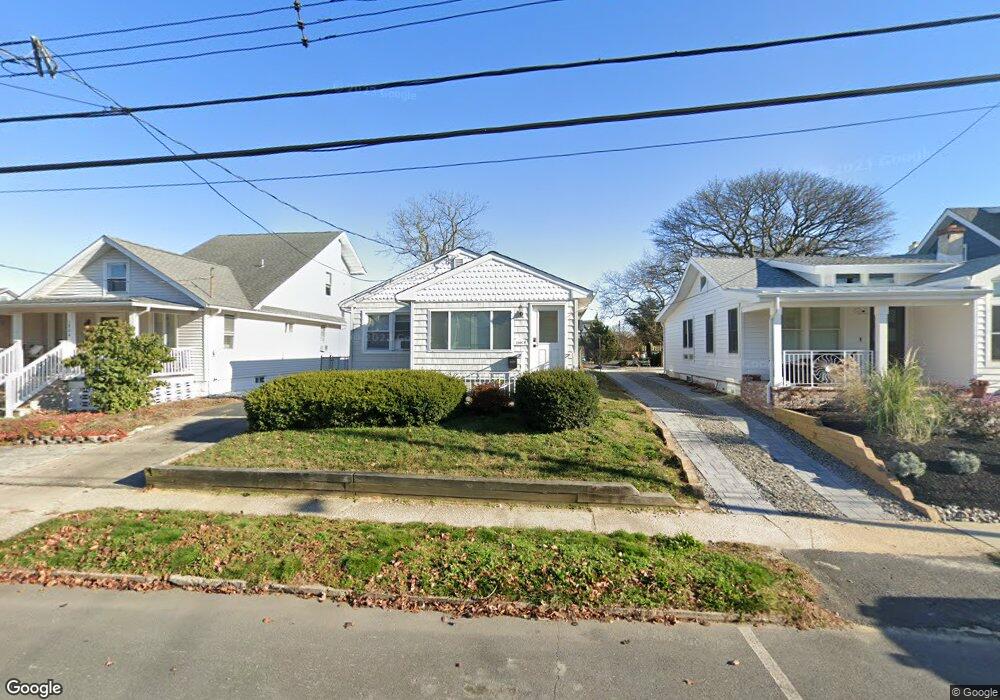
1806 B St Belmar, NJ 07719
Estimated Value: $723,000 - $882,000
3
Beds
1
Bath
1,056
Sq Ft
$757/Sq Ft
Est. Value
About This Home
This home is located at 1806 B St, Belmar, NJ 07719 and is currently estimated at $799,589, approximately $757 per square foot. 1806 B St is a home located in Monmouth County with nearby schools including Belmar Elementary School, St. Rose Grammar School, and St Rose High School.
Ownership History
Date
Name
Owned For
Owner Type
Purchase Details
Closed on
Jun 27, 2023
Sold by
Liotti Linda
Bought by
Liotti Linda and Liotti Joseph
Current Estimated Value
Home Financials for this Owner
Home Financials are based on the most recent Mortgage that was taken out on this home.
Original Mortgage
$300,000
Outstanding Balance
$201,700
Interest Rate
6.57%
Mortgage Type
New Conventional
Estimated Equity
$597,889
Purchase Details
Closed on
Aug 8, 2007
Sold by
Mcdermott Hugh J and Santullo Ellen Marie
Bought by
Rawlins Joyce
Create a Home Valuation Report for This Property
The Home Valuation Report is an in-depth analysis detailing your home's value as well as a comparison with similar homes in the area
Home Values in the Area
Average Home Value in this Area
Purchase History
| Date | Buyer | Sale Price | Title Company |
|---|---|---|---|
| Liotti Linda | -- | Old Republic Title | |
| Liotti Linda | -- | Old Republic Title | |
| Liotti Linda | $350,000 | Old Republic Title | |
| Rawlins Joyce | $525,000 | Multiple |
Source: Public Records
Mortgage History
| Date | Status | Borrower | Loan Amount |
|---|---|---|---|
| Open | Liotti Linda | $300,000 | |
| Closed | Liotti Linda | $300,000 |
Source: Public Records
Tax History Compared to Growth
Tax History
| Year | Tax Paid | Tax Assessment Tax Assessment Total Assessment is a certain percentage of the fair market value that is determined by local assessors to be the total taxable value of land and additions on the property. | Land | Improvement |
|---|---|---|---|---|
| 2025 | $6,047 | $415,600 | $331,600 | $84,000 |
| 2024 | $5,843 | $415,600 | $331,600 | $84,000 |
| 2023 | $5,843 | $415,600 | $331,600 | $84,000 |
| 2022 | $2,845 | $415,600 | $331,600 | $84,000 |
| 2021 | $2,845 | $415,600 | $331,600 | $84,000 |
| 2020 | $5,590 | $415,600 | $331,600 | $84,000 |
| 2019 | $5,590 | $415,600 | $331,600 | $84,000 |
| 2018 | $5,133 | $415,600 | $331,600 | $84,000 |
| 2017 | $5,008 | $415,600 | $331,600 | $84,000 |
| 2016 | $5,825 | $304,800 | $241,600 | $63,200 |
| 2015 | $5,465 | $284,800 | $221,600 | $63,200 |
| 2014 | $5,124 | $264,800 | $201,600 | $63,200 |
Source: Public Records
Map
Nearby Homes