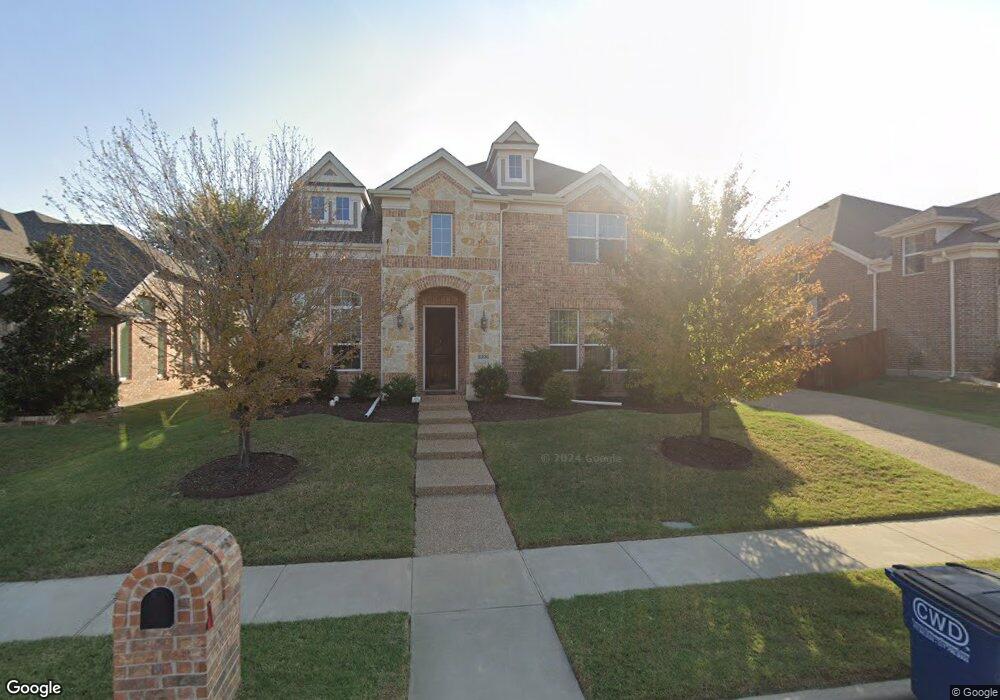
1806 Cort Ln Allen, TX 75013
North Allen NeighborhoodEstimated Value: $764,088 - $823,000
4
Beds
4
Baths
3,678
Sq Ft
$216/Sq Ft
Est. Value
About This Home
This home is located at 1806 Cort Ln, Allen, TX 75013 and is currently estimated at $792,772, approximately $215 per square foot. 1806 Cort Ln is a home located in Collin County with nearby schools including Beverly Cheatham Elementary School, Lowery Freshman Center, and Walter & Lois Curtis Middle School.
Ownership History
Date
Name
Owned For
Owner Type
Purchase Details
Closed on
Mar 10, 2020
Sold by
Kong Lionel Tzelok and Bui Annie Mong
Bought by
Kong Lionel Tze Lok and Bui Annie Mong
Current Estimated Value
Home Financials for this Owner
Home Financials are based on the most recent Mortgage that was taken out on this home.
Original Mortgage
$405,000
Outstanding Balance
$280,452
Interest Rate
3.5%
Mortgage Type
New Conventional
Estimated Equity
$512,320
Purchase Details
Closed on
Mar 31, 2017
Sold by
Grand Homes 2012 Lp
Bought by
Bich Bui Annie Mong and Kong Lionel Tzelok
Home Financials for this Owner
Home Financials are based on the most recent Mortgage that was taken out on this home.
Original Mortgage
$424,100
Interest Rate
4.16%
Mortgage Type
New Conventional
Purchase Details
Closed on
Oct 10, 2016
Sold by
That Jbgl Kittyhawk Llc
Bought by
Grand Homes 2012 Lp
Create a Home Valuation Report for This Property
The Home Valuation Report is an in-depth analysis detailing your home's value as well as a comparison with similar homes in the area
Home Values in the Area
Average Home Value in this Area
Purchase History
We collect this data history from publicly available records. To have your information removed, we recommend requesting removal directly through your county’s website.
| Date | Buyer | Sale Price | Title Company |
|---|---|---|---|
| Kong Lionel Tze Lok | -- | None Available | |
| Bich Bui Annie Mong | -- | Chicago Title | |
| Grand Homes 2012 Lp | -- | Chicago Title |
Source: Public Records
Mortgage History
We collect this data history from publicly available records. To have your information removed, we recommend requesting removal directly through your county’s website.
| Date | Status | Borrower | Loan Amount |
|---|---|---|---|
| Open | Kong Lionel Tze Lok | $405,000 | |
| Closed | Bich Bui Annie Mong | $424,100 |
Source: Public Records
Tax History
| Year | Tax Paid | Tax Assessment Tax Assessment Total Assessment is a certain percentage of the fair market value that is determined by local assessors to be the total taxable value of land and additions on the property. | Land | Improvement |
|---|---|---|---|---|
| 2025 | $12,091 | $791,489 | $200,000 | $601,886 |
| 2024 | $11,282 | $719,535 | $190,000 | $607,773 |
| 2023 | $11,282 | $654,123 | $160,000 | $584,211 |
| 2022 | $11,806 | $594,657 | $160,000 | $554,251 |
| 2021 | $11,494 | $540,597 | $135,000 | $405,597 |
| 2020 | $11,546 | $523,847 | $135,000 | $388,847 |
| 2019 | $12,011 | $519,941 | $135,000 | $384,941 |
| 2018 | $12,694 | $539,690 | $135,000 | $404,690 |
| 2017 | $6,563 | $279,050 | $110,000 | $169,050 |
| 2016 | $1,536 | $64,000 | $64,000 | $0 |
| 2015 | $999 | $64,000 | $64,000 | $0 |
Source: Public Records
Map
Nearby Homes
- 00 Natchez Trace
- 1905 Natchez Trace
- 1910 Natchez Trace
- 948 Holt Ln
- 1915 Pioneer Dr
- 923 S Fork Dr
- 2106 Wakefield Ln
- 920 White River Dr
- 917 Colorado Dr
- 2122 Wakefield Ln
- 2116 Channel Islands Dr
- 2255 Hermitage Dr
- 2257 Hermitage Dr
- 1019 Hot Springs Dr
- 2260 Richmond Ln
- 1080 Great Meadow Dr
- 1995 Verde Ct
- 1032 Boardwalk Rd
- 1030 Everglades Dr
- 1036 Boardwalk Rd
- 940 Herschell St
- 1808 Cort Ln
- 1911 Natchez Trace
- 1913 Natchez Trace
- 943 Abbott Ln
- 1909 Natchez Trace
- 941 Abbott Ln
- 1915 Natchez Trace
- 944 Herschell St
- 1907 Natchez Trace
- 945 Abbott Ln
- 945 Herschell St
- 1917 Natchez Trace
- 946 Herschell St
- 1804 Cort Ln
- 2013 E Kittyhawk Dr
- 940 Abbott Ln
- 0000 Natchez Trace
- 0000 Natchez Trace Unit Lot B
- 947 Abbott Ln
Your Personal Tour Guide
Ask me questions while you tour the home.