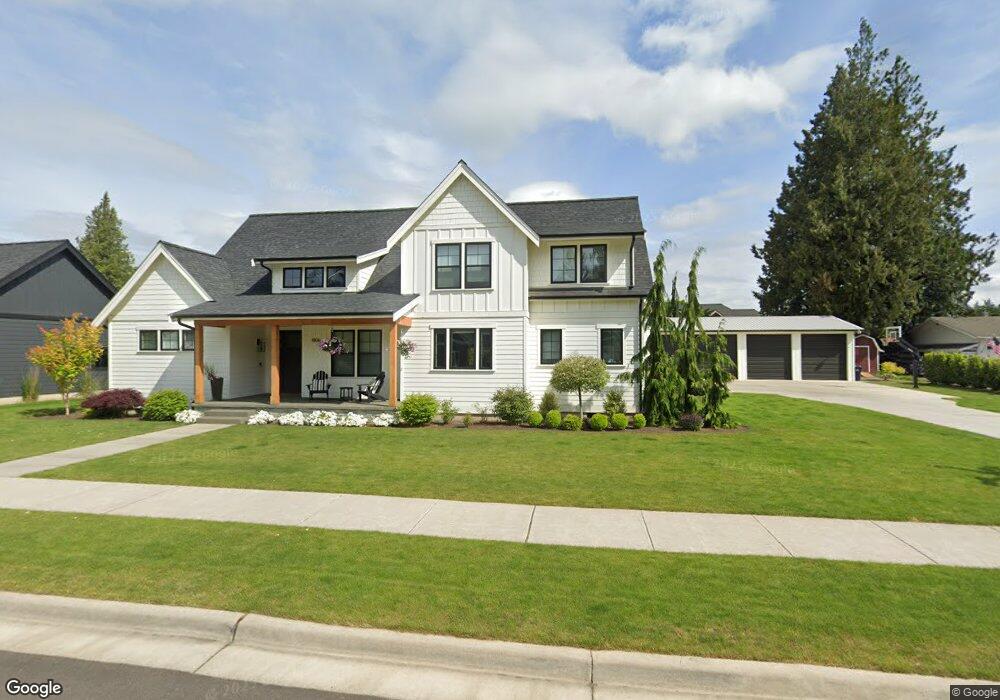
1806 Double Ditch Ct Lynden, WA 98264
Estimated Value: $1,062,000 - $1,147,000
4
Beds
4
Baths
3,171
Sq Ft
$351/Sq Ft
Est. Value
About This Home
This home is located at 1806 Double Ditch Ct, Lynden, WA 98264 and is currently estimated at $1,113,381, approximately $351 per square foot. 1806 Double Ditch Ct is a home located in Whatcom County with nearby schools including Lynden High School, Lynden Christian School, and Lynden Christian Schools: Administration.
Ownership History
Date
Name
Owned For
Owner Type
Purchase Details
Closed on
Aug 22, 2019
Sold by
Young Josephine and Kayser Joan
Bought by
Dykstra Robert and Dykstra Elizabeth
Current Estimated Value
Home Financials for this Owner
Home Financials are based on the most recent Mortgage that was taken out on this home.
Original Mortgage
$100,000
Interest Rate
3.8%
Mortgage Type
New Conventional
Purchase Details
Closed on
Aug 13, 2018
Sold by
Jack A Josephine Young Living Trust
Bought by
Young Josephine and Kayser Joan
Purchase Details
Closed on
Nov 9, 2017
Sold by
Young Jack A and Young Josephine
Bought by
Young Josephine and Kayser Joan E
Create a Home Valuation Report for This Property
The Home Valuation Report is an in-depth analysis detailing your home's value as well as a comparison with similar homes in the area
Home Values in the Area
Average Home Value in this Area
Purchase History
| Date | Buyer | Sale Price | Title Company |
|---|---|---|---|
| Dykstra Robert | $250,000 | Chicago Title Insurance | |
| Young Josephine | -- | Whatcom Land Title | |
| Young Josephine | -- | Whatcom Land Title | |
| Young Josephine | -- | Whatcom Land Title Co |
Source: Public Records
Mortgage History
| Date | Status | Borrower | Loan Amount |
|---|---|---|---|
| Closed | Dykstra Robert | $100,000 |
Source: Public Records
Tax History Compared to Growth
Tax History
| Year | Tax Paid | Tax Assessment Tax Assessment Total Assessment is a certain percentage of the fair market value that is determined by local assessors to be the total taxable value of land and additions on the property. | Land | Improvement |
|---|---|---|---|---|
| 2024 | $7,158 | $1,016,066 | $291,000 | $725,066 |
| 2023 | $7,158 | $997,179 | $300,000 | $697,179 |
| 2022 | $6,512 | $855,309 | $185,474 | $669,835 |
| 2021 | $6,387 | $706,858 | $153,282 | $553,576 |
| 2020 | $1,496 | $631,140 | $136,863 | $494,277 |
| 2019 | $1,645 | $154,812 | $125,663 | $29,149 |
| 2018 | $3,007 | $174,494 | $147,897 | $26,597 |
| 2017 | $2,776 | $261,973 | $132,750 | $129,223 |
| 2016 | $2,640 | $257,234 | $132,000 | $125,234 |
| 2015 | $2,339 | $243,261 | $126,960 | $116,301 |
| 2014 | -- | $235,008 | $122,640 | $112,368 |
| 2013 | -- | $232,368 | $120,000 | $112,368 |
Source: Public Records
Map
Nearby Homes
- 605 N Forest Ct
- 515 17th St
- 403 17th St
- 801 19th St
- 106 Fairside Dr Unit D
- 1882 Front St Unit B208
- 1882 Front St Unit B111
- 1584 Main St
- 8374 W Meadow Ln
- 210 Stremler Dr
- 1717 E St
- 2 Guide Meridian Rd
- 1510 E St
- 314 S 16th St
- 2010 Front St Unit 33
- 2016 Steelhead Way
- 1218 Front St
- 1774 Farmview Terrace
- 410 10th St
- 0 Guide Meridian Unit NWM2369980
- 1800 Double Ditch Ct
- 8321 Double Ditch Rd
- 8341 Double Ditch Rd
- 1812 Double Ditch Ct
- 1803 Double Ditch Ct
- 1818 Double Ditch Ct
- 8351 Double Ditch Rd
- 8340 Double Ditch Rd
- 8349 Double Ditch Rd
- 8353 Double Ditch Rd
- 1724 Village Dr
- 8347 Double Ditch Rd
- 8318 Double Ditch Rd
- 8303 Double Ditch Rd
- 1721 Village Dr
- 1824 Double Ditch Ct
- 700 Fern Dr
- 8363 Double Ditch Rd
- 1722 Village Dr
- 8362 Double Ditch Rd