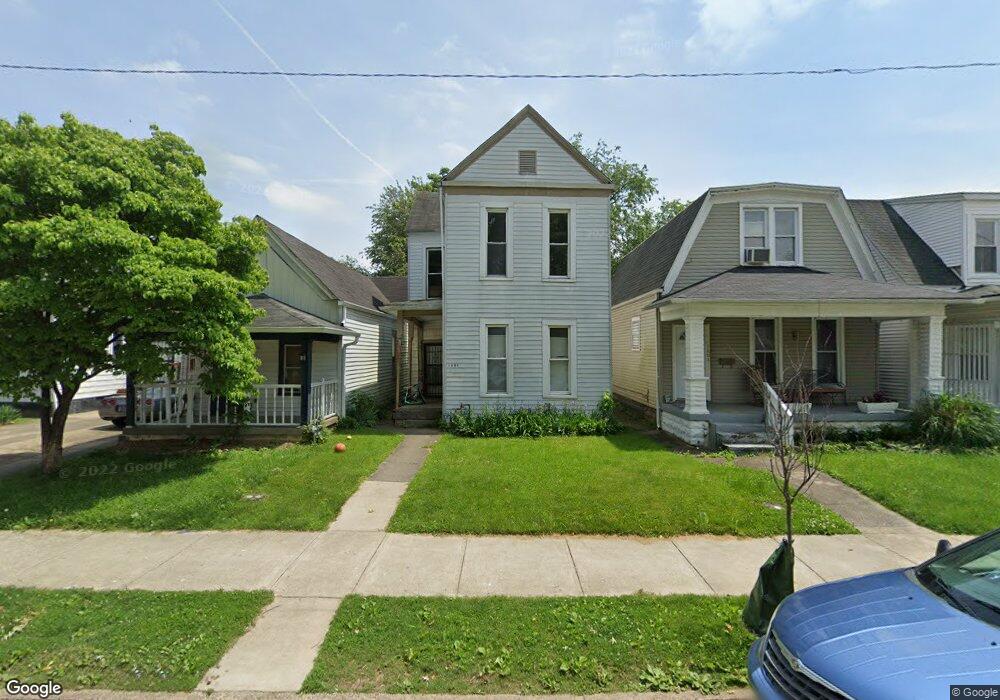
1806 E Oak St New Albany, IN 47150
Estimated Value: $147,719 - $224,000
3
Beds
1
Bath
1,692
Sq Ft
$113/Sq Ft
Est. Value
About This Home
This home is located at 1806 E Oak St, New Albany, IN 47150 and is currently estimated at $191,180, approximately $112 per square foot. 1806 E Oak St is a home located in Floyd County with nearby schools including Slate Run Elementary School, Hazelwood Middle School, and New Albany Senior High School.
Ownership History
Date
Name
Owned For
Owner Type
Purchase Details
Closed on
Oct 25, 2010
Sold by
Fannie Mae
Bought by
Citimortgage Inc
Current Estimated Value
Purchase Details
Closed on
May 18, 2010
Sold by
Roberts Joseph D
Bought by
Fannie Mae and Federal National Mortgage Association
Purchase Details
Closed on
Aug 17, 2007
Sold by
Delaware Limited Liability Co
Bought by
Edrington John
Purchase Details
Closed on
Apr 11, 2007
Sold by
Cotner Paul W
Bought by
Roberts Joseph D and Roberts Jamie L
Home Financials for this Owner
Home Financials are based on the most recent Mortgage that was taken out on this home.
Original Mortgage
$59,900
Interest Rate
6.19%
Mortgage Type
New Conventional
Purchase Details
Closed on
Aug 10, 2006
Sold by
Fanne Mae
Bought by
Cotner Paul W
Purchase Details
Closed on
Aug 13, 2005
Sold by
Riley Dale
Bought by
Gmac Mortgage Corp
Create a Home Valuation Report for This Property
The Home Valuation Report is an in-depth analysis detailing your home's value as well as a comparison with similar homes in the area
Home Values in the Area
Average Home Value in this Area
Purchase History
| Date | Buyer | Sale Price | Title Company |
|---|---|---|---|
| Citimortgage Inc | -- | None Available | |
| Fannie Mae | $74,867 | None Available | |
| Edrington John | -- | None Available | |
| Roberts Joseph D | -- | None Available | |
| Cotner Paul W | $18,000 | None Available | |
| Gmac Mortgage Corp | $45,688 | None Available |
Source: Public Records
Mortgage History
| Date | Status | Borrower | Loan Amount |
|---|---|---|---|
| Previous Owner | Roberts Joseph D | $59,900 |
Source: Public Records
Tax History Compared to Growth
Tax History
| Year | Tax Paid | Tax Assessment Tax Assessment Total Assessment is a certain percentage of the fair market value that is determined by local assessors to be the total taxable value of land and additions on the property. | Land | Improvement |
|---|---|---|---|---|
| 2024 | $1,603 | $75,500 | $9,400 | $66,100 |
| 2023 | $1,485 | $69,600 | $9,400 | $60,200 |
| 2022 | $1,311 | $61,400 | $9,400 | $52,000 |
| 2021 | $1,171 | $54,400 | $9,400 | $45,000 |
| 2020 | $1,117 | $51,800 | $9,400 | $42,400 |
| 2019 | $1,152 | $53,400 | $9,400 | $44,000 |
| 2018 | $1,113 | $51,300 | $9,400 | $41,900 |
| 2017 | $1,082 | $49,000 | $9,400 | $39,600 |
| 2016 | $970 | $48,500 | $9,400 | $39,100 |
| 2014 | $764 | $38,200 | $9,400 | $28,800 |
| 2013 | -- | $37,300 | $9,400 | $27,900 |
Source: Public Records
Map
Nearby Homes
- 1748 E Oak St
- 1809 E Oak St
- 1743 E Spring St
- 1727 E Oak St
- 1922 Division St
- 608 E Oak St
- 1913 Center St
- 1919 Center St
- 1935 Center St
- 1605 Culbertson Ave
- 1619 King St
- 1617 King St
- 336 E 16th St
- 330 E 16th St
- 2030 Ekin Ave
- 335 E 15th St
- 2124 E Oak St
- 2024 E Market St
- 1011 Vincennes St Unit 5
- 2107 E Market St