Estimated Value: $148,000 - $159,000
2
Beds
2
Baths
1,274
Sq Ft
$120/Sq Ft
Est. Value
About This Home
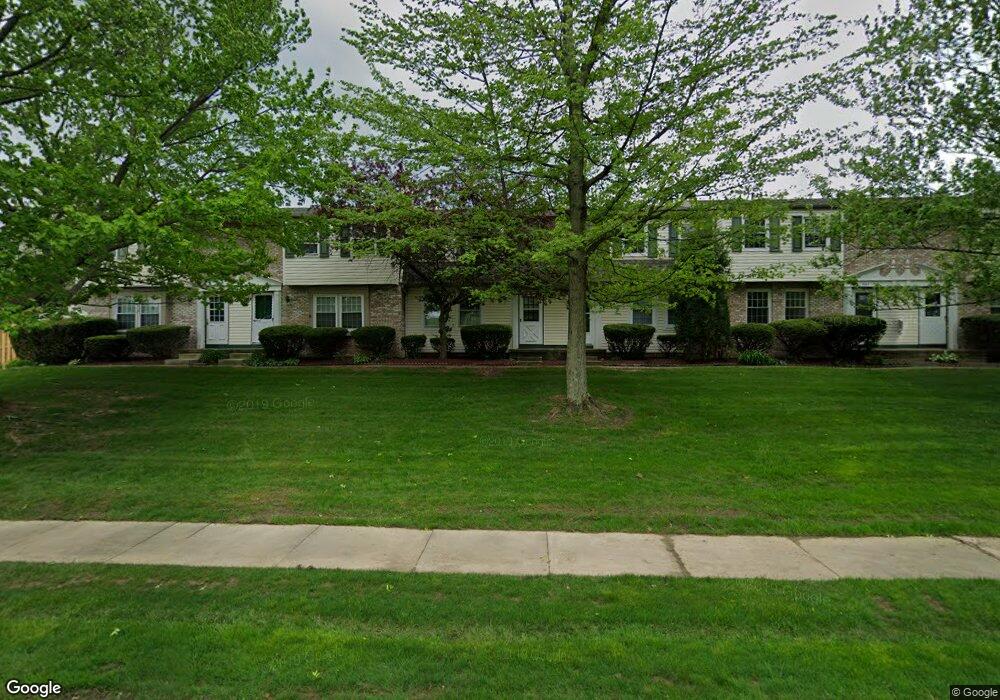
This home is located at 1806 Higby Dr Unit 11E, Stow, OH 44224 and is currently estimated at $153,244, approximately $120 per square foot. 1806 Higby Dr Unit 11E is a home located in Summit County with nearby schools including Stow-Munroe Falls High School, Primrose School of Hudson, and Holy Family Elementary School.
Ownership History
Date
Name
Owned For
Owner Type
Purchase Details
Closed on
Aug 25, 2004
Sold by
Joslin John E
Bought by
Joslin Jennifer R
Current Estimated Value
Home Financials for this Owner
Home Financials are based on the most recent Mortgage that was taken out on this home.
Original Mortgage
$70,150
Outstanding Balance
$29,740
Interest Rate
3.75%
Mortgage Type
Unknown
Estimated Equity
$123,504
Purchase Details
Closed on
Aug 23, 2001
Sold by
Werner Davina L and Werner James C
Bought by
Joslin John E
Home Financials for this Owner
Home Financials are based on the most recent Mortgage that was taken out on this home.
Original Mortgage
$76,268
Interest Rate
7.28%
Purchase Details
Closed on
Oct 15, 1999
Sold by
Grund David L and Grund Shirley L
Bought by
Werner Davina L and Werner James C
Purchase Details
Closed on
Sep 6, 1996
Sold by
Stone Mary A
Bought by
Grund David L
Home Financials for this Owner
Home Financials are based on the most recent Mortgage that was taken out on this home.
Original Mortgage
$54,300
Interest Rate
8.25%
Mortgage Type
New Conventional
Create a Home Valuation Report for This Property
The Home Valuation Report is an in-depth analysis detailing your home's value as well as a comparison with similar homes in the area
Home Values in the Area
Average Home Value in this Area
Purchase History
| Date | Buyer | Sale Price | Title Company |
|---|---|---|---|
| Joslin Jennifer R | $87,700 | -- | |
| Joslin John E | $83,000 | Midland Commerce Group | |
| Werner Davina L | -- | Wigley Title Agency Inc | |
| Grund David L | $67,900 | -- |
Source: Public Records
Mortgage History
| Date | Status | Borrower | Loan Amount |
|---|---|---|---|
| Open | Joslin Jennifer R | $70,150 | |
| Closed | Joslin John E | $76,268 | |
| Previous Owner | Grund David L | $54,300 |
Source: Public Records
Tax History Compared to Growth
Tax History
| Year | Tax Paid | Tax Assessment Tax Assessment Total Assessment is a certain percentage of the fair market value that is determined by local assessors to be the total taxable value of land and additions on the property. | Land | Improvement |
|---|---|---|---|---|
| 2025 | $2,181 | $37,863 | $4,333 | $33,530 |
| 2024 | $2,181 | $37,863 | $4,333 | $33,530 |
| 2023 | $2,181 | $37,863 | $4,333 | $33,530 |
| 2022 | $1,876 | $28,623 | $3,234 | $25,389 |
| 2021 | $1,685 | $28,623 | $3,234 | $25,389 |
| 2020 | $1,657 | $28,620 | $3,230 | $25,390 |
| 2019 | $1,479 | $23,750 | $3,200 | $20,550 |
| 2018 | $1,456 | $23,750 | $3,090 | $20,660 |
| 2017 | $1,403 | $23,750 | $3,090 | $20,660 |
| 2016 | $1,431 | $22,220 | $3,090 | $19,130 |
| 2015 | $1,403 | $22,220 | $3,090 | $19,130 |
| 2014 | $1,405 | $22,220 | $3,090 | $19,130 |
| 2013 | $1,641 | $26,330 | $3,090 | $23,240 |
Source: Public Records
Map
Nearby Homes
- 1808 Higby Dr Unit A
- 1627 Cypress Ct
- 1937 Leisure Ln
- 1938 Higby Dr
- 4630 Red Willow Rd
- 0 Hibbard Dr
- 4877 Cedar Crest Ln
- 1664 Cypress Ct
- 4891 Cedar Crest Ln
- 1470 Mac Dr
- 5072 Commanche Trail
- 1511 Apollo Dr
- V/L Lawnmark Dr
- 2327 Crockett Cir
- 1884 Village Ct Unit X66
- 2140 Woodlawn Cir Unit 2144
- 0 Stow Rd Unit 5102979
- 1759 E Sapphire Dr
- 2380 Port Williams Dr Unit 2380
- 1620 Sapphire Dr
- 1808 Higby Dr
- 1808 Higby Dr
- 1806 Higby Dr Unit F
- 1806 Higby Dr
- 1810 Higby Dr Unit A
- 1810 Higby Dr
- 1810 Higby Dr Unit J
- 1804 Higby Dr
- 1804 Higby Dr
- 1816 Higby Dr
- 1814 Higby Dr
- 1816 Higby Dr
- 1816 Higby Dr
- 1802 Higby Dr Unit A
- 1802 Higby Dr
- 1818 Higby Dr
- 1818 Higby Dr
- 1818 Higby Dr Unit B
- 1820 Higby Dr
- 1820 Higby Dr