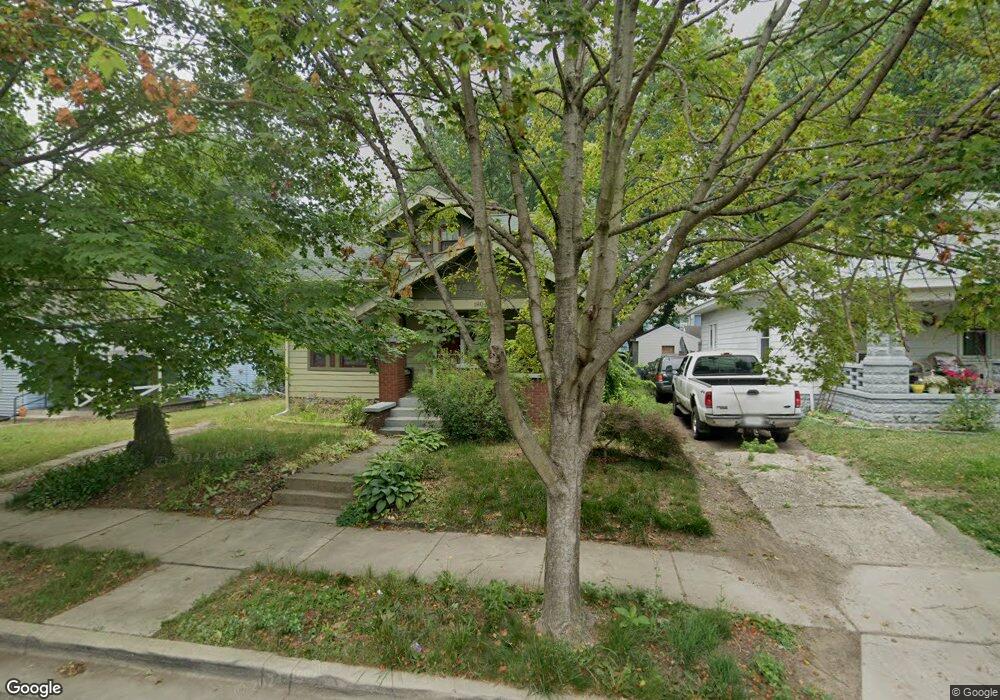
1806 Maple St Lafayette, IN 47904
Saint Lawrence McAllister NeighborhoodEstimated Value: $148,000 - $189,000
2
Beds
1
Bath
756
Sq Ft
$220/Sq Ft
Est. Value
About This Home
This home is located at 1806 Maple St, Lafayette, IN 47904 and is currently estimated at $166,687, approximately $220 per square foot. 1806 Maple St is a home located in Tippecanoe County with nearby schools including Vinton Elementary School, Sunnyside Intermediate School, and Lafayette Tecumseh Junior High School.
Ownership History
Date
Name
Owned For
Owner Type
Purchase Details
Closed on
Feb 22, 2011
Sold by
Secretary Of Housing & Urban Development
Bought by
Harney James and Ryan Christine
Current Estimated Value
Purchase Details
Closed on
Nov 30, 2010
Sold by
Phh Mortgage Corporation
Bought by
Secretary Of Housing & Urban Development
Purchase Details
Closed on
Nov 5, 2010
Sold by
Westbrooks James
Bought by
Phh Mortgage Corporation
Purchase Details
Closed on
Jul 16, 2002
Sold by
Wadley John A and Wadley Jean M
Bought by
Westbrooks James
Home Financials for this Owner
Home Financials are based on the most recent Mortgage that was taken out on this home.
Original Mortgage
$78,665
Interest Rate
6.79%
Mortgage Type
FHA
Create a Home Valuation Report for This Property
The Home Valuation Report is an in-depth analysis detailing your home's value as well as a comparison with similar homes in the area
Home Values in the Area
Average Home Value in this Area
Purchase History
| Date | Buyer | Sale Price | Title Company |
|---|---|---|---|
| Harney James | -- | None Available | |
| Secretary Of Housing & Urban Development | -- | None Available | |
| Phh Mortgage Corporation | $84,856 | None Available | |
| Westbrooks James | -- | -- |
Source: Public Records
Mortgage History
| Date | Status | Borrower | Loan Amount |
|---|---|---|---|
| Previous Owner | Westbrooks James | $78,665 |
Source: Public Records
Tax History
| Year | Tax Paid | Tax Assessment Tax Assessment Total Assessment is a certain percentage of the fair market value that is determined by local assessors to be the total taxable value of land and additions on the property. | Land | Improvement |
|---|---|---|---|---|
| 2024 | $799 | $110,000 | $13,000 | $97,000 |
| 2023 | $706 | $103,000 | $13,000 | $90,000 |
| 2022 | $653 | $88,200 | $13,000 | $75,200 |
| 2021 | $462 | $74,000 | $13,000 | $61,000 |
| 2020 | $400 | $65,900 | $13,000 | $52,900 |
| 2019 | $370 | $61,500 | $11,000 | $50,500 |
| 2018 | $354 | $58,700 | $11,000 | $47,700 |
| 2017 | $346 | $58,200 | $11,000 | $47,200 |
| 2016 | $324 | $55,800 | $11,000 | $44,800 |
| 2014 | $306 | $53,700 | $11,000 | $42,700 |
| 2013 | $306 | $54,500 | $11,000 | $43,500 |
Source: Public Records
Map
Nearby Homes
- 1925 Maple St
- 1829 Greenbush St
- 1931 Morton St
- 1803 Pierce St
- 1811 N 15th St
- 2119 Perrine St
- 1411 N 14th St
- 1607 N 13th St
- 1310 Hart St
- 2022 Elk St
- 1914 Colfax St
- 1039 Tulip Ln
- 926 N 19th St
- 2204 Sunrise Ave
- 2211 N 24th St
- 1123 N 9th St
- 1108 Salem St
- 2717 Torrenga Terrace
- 2519 Rainbow Dr
- 2716 Longlois Dr
Your Personal Tour Guide
Ask me questions while you tour the home.