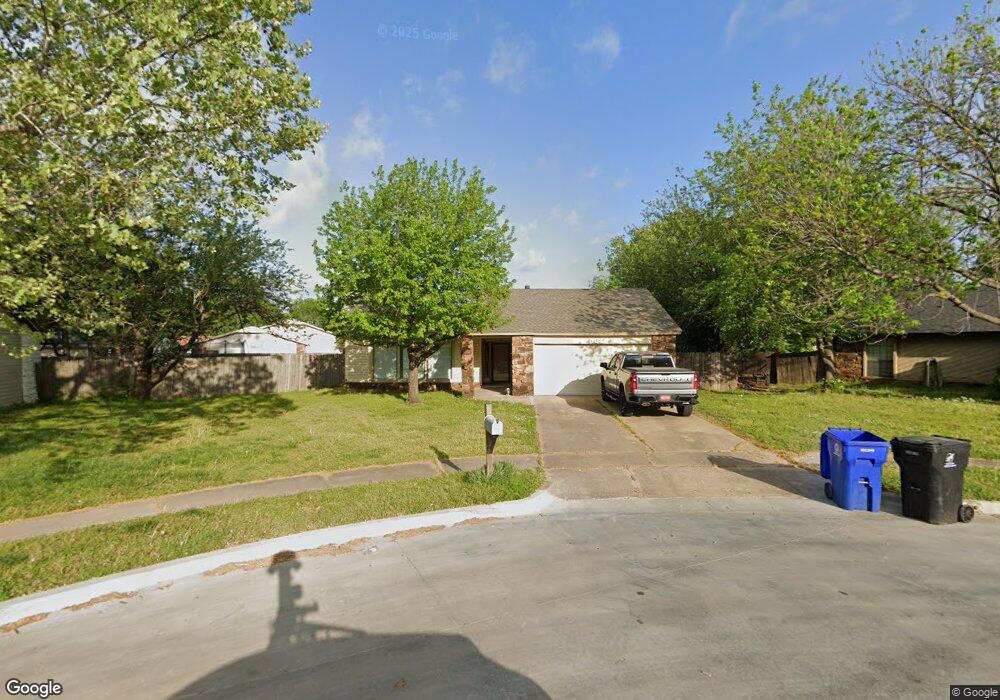
1806 N Butternut Ct Broken Arrow, OK 74012
Southbrook NeighborhoodEstimated Value: $209,151 - $251,000
--
Bed
2
Baths
1,633
Sq Ft
$140/Sq Ft
Est. Value
About This Home
This home is located at 1806 N Butternut Ct, Broken Arrow, OK 74012 and is currently estimated at $228,038, approximately $139 per square foot. 1806 N Butternut Ct is a home located in Tulsa County with nearby schools including McAuliffe Elementary School, Union 8th Grade Center, and Union 6th-7th Grade Center.
Ownership History
Date
Name
Owned For
Owner Type
Purchase Details
Closed on
Sep 27, 2019
Sold by
Mcdaniel Bob J and Mcdaniel Antoinette M
Bought by
Bjm Homes Llc
Current Estimated Value
Purchase Details
Closed on
Jan 30, 2014
Sold by
Kuykendall Joy L
Bought by
Mcdaniel Bob J and Mcdaniel Antoinette M
Purchase Details
Closed on
May 12, 1998
Sold by
Glanz Stanley and Hancock Phillip L
Bought by
Emc Mtg Corp
Purchase Details
Closed on
May 1, 1982
Create a Home Valuation Report for This Property
The Home Valuation Report is an in-depth analysis detailing your home's value as well as a comparison with similar homes in the area
Home Values in the Area
Average Home Value in this Area
Purchase History
| Date | Buyer | Sale Price | Title Company |
|---|---|---|---|
| Bjm Homes Llc | -- | None Available | |
| Mcdaniel Bob J | $55,833 | None Available | |
| Emc Mtg Corp | -- | First American Title & Abstr | |
| -- | $70,000 | -- |
Source: Public Records
Tax History Compared to Growth
Tax History
| Year | Tax Paid | Tax Assessment Tax Assessment Total Assessment is a certain percentage of the fair market value that is determined by local assessors to be the total taxable value of land and additions on the property. | Land | Improvement |
|---|---|---|---|---|
| 2024 | $1,659 | $13,498 | $2,210 | $11,288 |
| 2023 | $1,659 | $12,856 | $2,174 | $10,682 |
| 2022 | $1,593 | $12,243 | $3,453 | $8,790 |
| 2021 | $1,522 | $11,660 | $3,289 | $8,371 |
| 2020 | $1,532 | $11,660 | $3,289 | $8,371 |
| 2019 | $1,788 | $13,625 | $3,232 | $10,393 |
| 2018 | $1,697 | $12,976 | $3,078 | $9,898 |
| 2017 | $1,638 | $12,359 | $2,932 | $9,427 |
| 2016 | $1,540 | $11,770 | $3,289 | $8,481 |
| 2015 | $1,540 | $11,770 | $3,289 | $8,481 |
| 2014 | $1,428 | $11,979 | $3,289 | $8,690 |
Source: Public Records
Map
Nearby Homes
- 4441 W Queens St
- 11778 E 63rd St
- 6209 S 116th East Ave
- 1429 N Yellowood Ave
- 6422 S 111th East Ave
- 11033 E 66th St
- 6727 S 112th East Ave
- 4429 W Norman St
- 11329 E 61st St
- 6407 S 109th East Ave
- 1312 N Willow Ave
- 4419 W Madison St
- 1109 N Cypress Ave
- 2416 W Lansing Place
- 910 N Butternut Ct
- 905 N Butternut Ave
- 708 N Aster Ave
- 4501 W Hartford St
- 4400 W Freeport Cir
- 4408 W Elgin St
- 1810 N Butternut Ct
- 1802 N Butternut Ct
- 1809 N Cypress Ave
- 1805 N Cypress Ave
- 1813 N Cypress Ave
- 1801 N Cypress Ave
- 1718 N Butternut Ct
- 1811 N Butternut Ct
- 1717 N Cypress Ave
- 4521 W Tacoma St
- 4525 W Tacoma St
- 4525 W Tacoma St
- 1807 N Butternut Ct
- 4517 W Tacoma St
- 1803 N Butternut Ct
- 1714 N Butternut Ct
- 4529 W Tacoma St
- 4513 W Tacoma St
- 1713 N Cypress Ave
- 1719 N Butternut Ct
