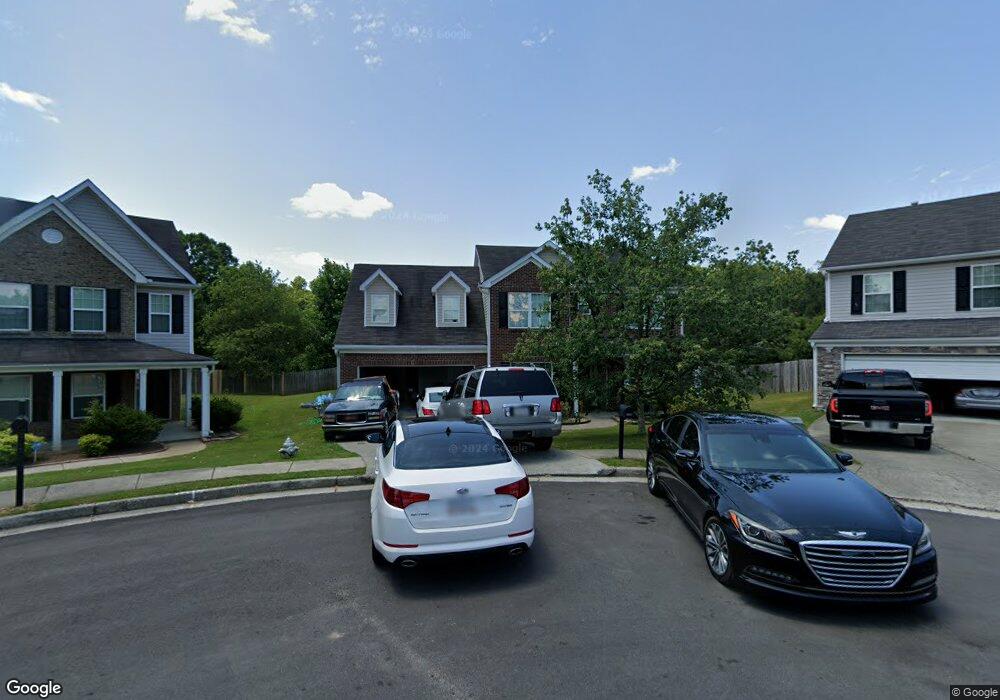
1806 Nichol Ferry Ct NE Dacula, GA 30019
Estimated Value: $407,734 - $431,000
4
Beds
3
Baths
2,304
Sq Ft
$181/Sq Ft
Est. Value
About This Home
This home is located at 1806 Nichol Ferry Ct NE, Dacula, GA 30019 and is currently estimated at $417,434, approximately $181 per square foot. 1806 Nichol Ferry Ct NE is a home located in Gwinnett County with nearby schools including Freeman's Mill Elementary School, Twin Rivers Middle School, and Mountain View High School.
Ownership History
Date
Name
Owned For
Owner Type
Purchase Details
Closed on
Oct 24, 2023
Sold by
Hudson Sfrtrs Property Holdings 2 Llc
Bought by
Mock Antequera Chiu Sang A and Jimenez Catari Karelys
Current Estimated Value
Purchase Details
Closed on
Aug 15, 2023
Sold by
Hudson Sfr Property Holdings 3 Llc
Bought by
Hudson Sfrtrs Property Holdings 2 Llc and Hudson Sfrtrs Property Holdings Ii Llc
Purchase Details
Closed on
Feb 16, 2022
Sold by
Zillow Homes Property Trust
Bought by
Hudson Sfr Porperty Holdings Ii Llc
Purchase Details
Closed on
Oct 22, 2021
Sold by
Eudoxy Catrina
Bought by
Zillow Homes Property Trust
Purchase Details
Closed on
Dec 19, 2006
Sold by
Pinnacle Finl
Bought by
Eudoxy Catrina
Home Financials for this Owner
Home Financials are based on the most recent Mortgage that was taken out on this home.
Original Mortgage
$156,000
Interest Rate
6.1%
Mortgage Type
New Conventional
Purchase Details
Closed on
Aug 30, 2006
Sold by
Gmac Mtg
Bought by
Pinnacle Finl
Purchase Details
Closed on
May 2, 2006
Sold by
Dabney Mark A and Dabney Autavea L
Bought by
Gmac Mtg
Create a Home Valuation Report for This Property
The Home Valuation Report is an in-depth analysis detailing your home's value as well as a comparison with similar homes in the area
Home Values in the Area
Average Home Value in this Area
Purchase History
| Date | Buyer | Sale Price | Title Company |
|---|---|---|---|
| Mock Antequera Chiu Sang A | $390,000 | -- | |
| Hudson Sfrtrs Property Holdings 2 Llc | -- | -- | |
| Hudson Sfr Porperty Holdings Ii Llc | $378,900 | -- | |
| Zillow Homes Property Trust | $379,300 | -- | |
| Eudoxy Catrina | $195,000 | -- | |
| Pinnacle Finl | -- | -- | |
| Gmac Mtg | $163,001 | -- |
Source: Public Records
Mortgage History
| Date | Status | Borrower | Loan Amount |
|---|---|---|---|
| Previous Owner | Eudoxy Catrina | $156,000 | |
| Previous Owner | Eudoxy Catrina | $19,500 |
Source: Public Records
Tax History Compared to Growth
Tax History
| Year | Tax Paid | Tax Assessment Tax Assessment Total Assessment is a certain percentage of the fair market value that is determined by local assessors to be the total taxable value of land and additions on the property. | Land | Improvement |
|---|---|---|---|---|
| 2025 | $6,192 | $166,840 | $26,000 | $140,840 |
| 2024 | $5,874 | $156,000 | $30,000 | $126,000 |
| 2023 | $5,874 | $151,560 | $30,000 | $121,560 |
| 2022 | $5,181 | $137,360 | $28,000 | $109,360 |
| 2021 | $4,227 | $108,840 | $20,000 | $88,840 |
| 2020 | $3,742 | $94,800 | $20,000 | $74,800 |
| 2019 | $3,605 | $94,800 | $20,000 | $74,800 |
| 2018 | $3,406 | $89,040 | $16,800 | $72,240 |
| 2016 | $2,803 | $71,360 | $12,800 | $58,560 |
| 2015 | $2,678 | $66,920 | $11,200 | $55,720 |
| 2014 | -- | $66,920 | $11,200 | $55,720 |
Source: Public Records
Map
Nearby Homes
- 1827 Scouts Walk
- 2431 Lance Ridge Way
- 1603 Fort Perry Way
- 2706 Captain Ct
- 2425 Fort Daniels Dr Unit 3A
- 2585 Braselton Hwy
- 2439 Canter Brook Ct Unit 1
- 1720 Fort Daniels Trail
- 2765 Daniel Park Run Unit 3
- 0 Hog Mountain Church Road and Auburn Rd
- 1618 Rocky Knoll Ln
- 1655 Brisbane Dr
- 2416 Moultrie Ct
- 2674 Rocky Knoll Ct
- 2687 High Creek Run
- 1521 Rocky Knoll Ln
- 2955 Windsong Park Ln Unit 1
- 2915 Dacula Oaks Dr Unit 1
- 1806 Nichol Ferry Ct
- 1805 Nichol Ferry Ct
- 1816 Nichol Ferry Ct
- 1826 Nichol Ferry Ct NE
- 1826 Nichol Ferry Ct
- 1815 Nichol Ferry Ct
- 2641 Lance Ridge Way
- 2611 Lance Ridge Way
- 0 Nichol Ferry Ct NE
- 2651 Lance Ridge Way
- 2622 Lance Ridge Way NE
- 2601 Lance Ridge Way
- 2622 Lance Ridge Way
- 1835 Betty Sue Ct
- 2622 Lance Ridge Way Unit 2
- 1770 Pine Fort Ct Unit 2
- 2632 Lance Ridge Way
- 2630 Fort Daniels Dr
- 2642 Lance Ridge Way Unit 2
- 2591 Lance Ridge Way Unit 2