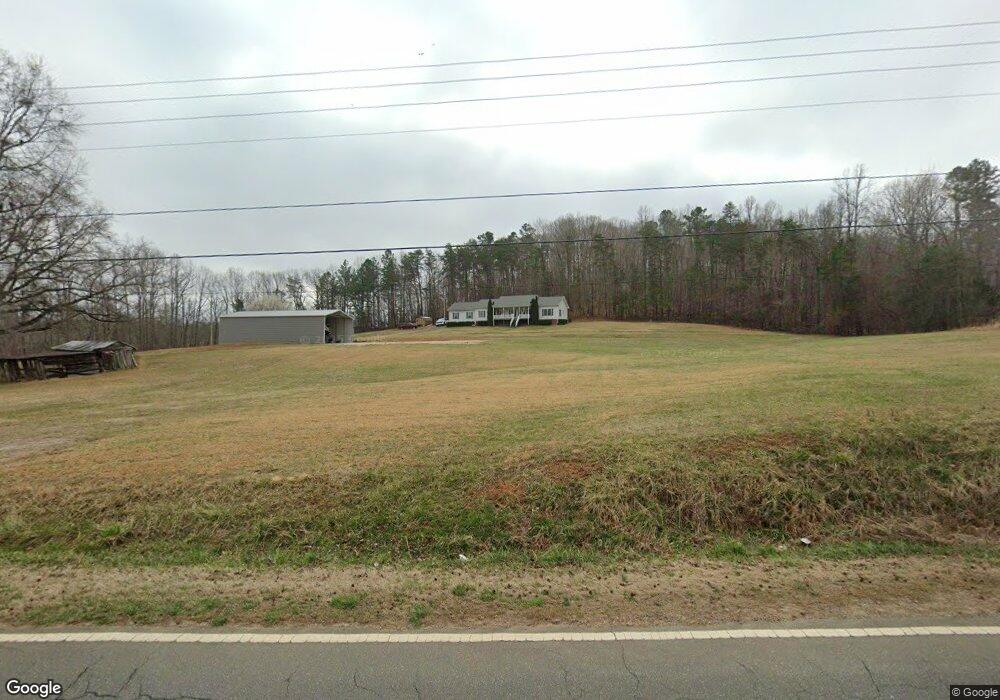
1806 Red Mountain Rd Rougemont, NC 27572
Estimated Value: $363,000 - $425,000
3
Beds
2
Baths
1,848
Sq Ft
$218/Sq Ft
Est. Value
About This Home
This home is located at 1806 Red Mountain Rd, Rougemont, NC 27572 and is currently estimated at $402,672, approximately $217 per square foot. 1806 Red Mountain Rd is a home located in Durham County with nearby schools including Mangum Elementary School, Lucas Middle School, and Northern High School.
Ownership History
Date
Name
Owned For
Owner Type
Purchase Details
Closed on
Jan 30, 2001
Sold by
Bowen Rufus and Bowen Nellie Gray
Bought by
Bowen Rufus Wayne and Bowen Ronda F
Current Estimated Value
Create a Home Valuation Report for This Property
The Home Valuation Report is an in-depth analysis detailing your home's value as well as a comparison with similar homes in the area
Home Values in the Area
Average Home Value in this Area
Purchase History
| Date | Buyer | Sale Price | Title Company |
|---|---|---|---|
| Bowen Rufus Wayne | -- | -- |
Source: Public Records
Tax History
| Year | Tax Paid | Tax Assessment Tax Assessment Total Assessment is a certain percentage of the fair market value that is determined by local assessors to be the total taxable value of land and additions on the property. | Land | Improvement |
|---|---|---|---|---|
| 2025 | $2,680 | $359,011 | $64,832 | $294,179 |
| 2024 | $2,466 | $238,091 | $43,797 | $194,294 |
| 2023 | $2,324 | $238,091 | $43,797 | $194,294 |
| 2022 | $2,216 | $238,091 | $43,797 | $194,294 |
| 2021 | $1,955 | $238,091 | $43,797 | $194,294 |
| 2020 | $1,931 | $238,091 | $43,797 | $194,294 |
| 2019 | $1,931 | $238,091 | $43,797 | $194,294 |
| 2018 | $1,737 | $198,117 | $35,330 | $162,787 |
| 2017 | $1,717 | $198,117 | $35,330 | $162,787 |
| 2016 | $1,662 | $198,117 | $35,330 | $162,787 |
| 2015 | $1,598 | $163,618 | $21,300 | $142,318 |
| 2014 | $1,598 | $163,618 | $21,300 | $142,318 |
Source: Public Records
Map
Nearby Homes
- 2008 Red Mountain Rd
- 1018 Christy Ridge Ct
- 202 Equestrian Chase
- 709 Lake Winds Trail
- 2702 Red Valley Dr
- 1403 Moores Mill Rd
- 13013 Meadow Ridge Dr
- 13205 N Roxboro St
- 13011 N Roxboro St
- 11907 N Roxboro St
- 220 Bacon Rd
- 1270 Moores Mill Rd
- 220 Bill Poole Rd
- 512 Bacon Rd
- 673 Bill Poole Rd
- 297 Fork Junction Rd
- 33 Fire Tower Dr
- 10504 N Roxboro St
- 0 Weaver Ridge Rd Unit 10137151
- 129 Family Dr
- 1812 Red Mountain Rd
- 1607 Red Mountain Rd
- 1801 Old Red Mountain Rd
- 1508 Red Mountain Rd
- 1512 Red Mountain Rd
- 1805 Old Red Mountain Rd
- 1511 Red Mountain Rd
- 1504 Red Mountain Rd
- 1908 Old Red Mountain Rd
- 1821 Old Red Mountain Rd
- 1505 Red Mountain Rd
- 1475 Red Mountain Rd Unit 1423
- 1905 Old Red Mountain Rd
- 2030 Red Mountain Rd
- 1907 Old Red Mountain Rd
- 2120 Red Mountain Rd
- 2203 Red Mountain Rd
- 2315 Red Mountain Rd
- 13015 Hampton Rd
- 13023 Hampton Rd
Your Personal Tour Guide
Ask me questions while you tour the home.