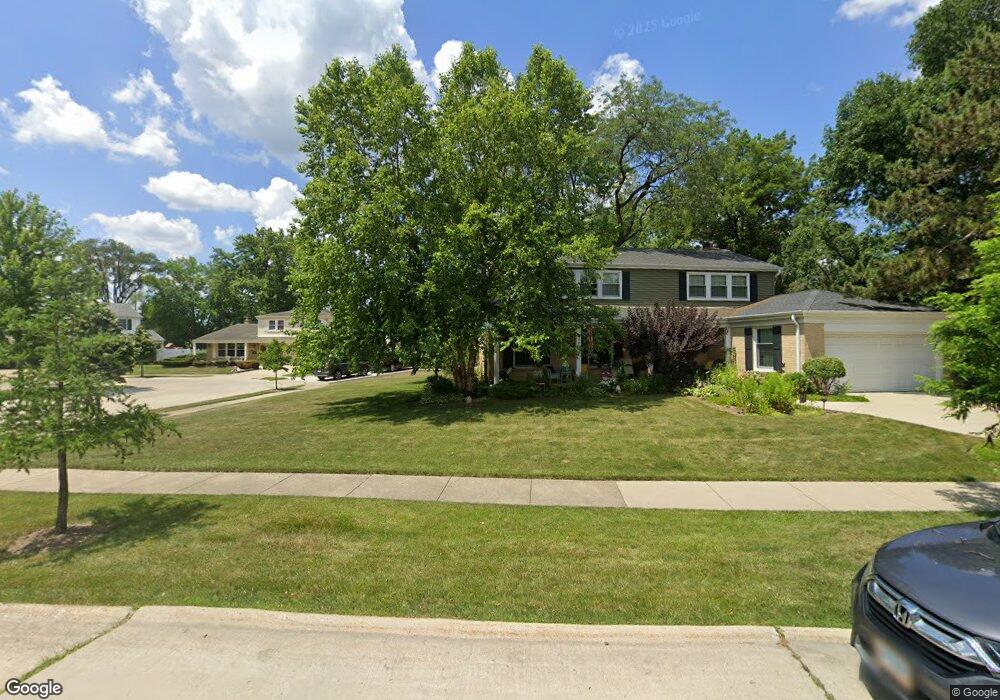
1806 S Highland Ave Unit 3 Arlington Heights, IL 60005
Surrey Ridge NeighborhoodEstimated Value: $600,000 - $656,000
4
Beds
3
Baths
2,347
Sq Ft
$269/Sq Ft
Est. Value
About This Home
This home is located at 1806 S Highland Ave Unit 3, Arlington Heights, IL 60005 and is currently estimated at $632,000, approximately $269 per square foot. 1806 S Highland Ave Unit 3 is a home located in Cook County with nearby schools including Holmes Jr High School, Juliette Low Elementary School, and Rolling Meadows High School.
Ownership History
Date
Name
Owned For
Owner Type
Purchase Details
Closed on
Jun 10, 2019
Sold by
Holt Jack C and Holt Pamela
Bought by
Holt Jack C and Holt Pamela D
Current Estimated Value
Purchase Details
Closed on
Apr 8, 2011
Sold by
Ricchiuto Kevin A
Bought by
Holt Jack C and Holt Pamela
Home Financials for this Owner
Home Financials are based on the most recent Mortgage that was taken out on this home.
Original Mortgage
$249,900
Outstanding Balance
$173,373
Interest Rate
4.92%
Mortgage Type
New Conventional
Estimated Equity
$458,627
Purchase Details
Closed on
Jul 25, 2006
Sold by
Ricchiuto Patricia D
Bought by
Ricchiuto Kevin A
Purchase Details
Closed on
Jun 14, 2006
Sold by
Ricchiuto Patricia D
Bought by
Ricchiuto Patricia D and Ricchiuto Kevin A
Purchase Details
Closed on
Jun 7, 2006
Sold by
Ricchiuto Patricia Denise
Bought by
Ricchiuto Patricia Denise and Ricchiuto Kevin A
Purchase Details
Closed on
Jul 1, 2003
Sold by
Ricchiuto Patricia D
Bought by
Ricchiuto Patricia D and The Patricia D Ricchiuto Revocable Livin
Create a Home Valuation Report for This Property
The Home Valuation Report is an in-depth analysis detailing your home's value as well as a comparison with similar homes in the area
Home Values in the Area
Average Home Value in this Area
Purchase History
| Date | Buyer | Sale Price | Title Company |
|---|---|---|---|
| Holt Jack C | -- | None Available | |
| Holt Jack C | $295,000 | None Available | |
| Ricchiuto Kevin A | -- | None Available | |
| Ricchiuto Patricia D | -- | None Available | |
| Ricchiuto Patricia Denise | -- | None Available | |
| Ricchiuto Patricia D | -- | -- |
Source: Public Records
Mortgage History
| Date | Status | Borrower | Loan Amount |
|---|---|---|---|
| Open | Holt Jack C | $249,900 |
Source: Public Records
Tax History Compared to Growth
Tax History
| Year | Tax Paid | Tax Assessment Tax Assessment Total Assessment is a certain percentage of the fair market value that is determined by local assessors to be the total taxable value of land and additions on the property. | Land | Improvement |
|---|---|---|---|---|
| 2024 | $11,300 | $47,000 | $14,782 | $32,218 |
| 2023 | $10,756 | $47,000 | $14,782 | $32,218 |
| 2022 | $10,756 | $47,000 | $14,782 | $32,218 |
| 2021 | $9,941 | $38,504 | $9,608 | $28,896 |
| 2020 | $9,719 | $38,504 | $9,608 | $28,896 |
| 2019 | $9,907 | $43,263 | $9,608 | $33,655 |
| 2018 | $9,288 | $36,646 | $8,130 | $28,516 |
| 2017 | $9,171 | $36,646 | $8,130 | $28,516 |
| 2016 | $10,308 | $39,964 | $8,130 | $31,834 |
| 2015 | $9,665 | $34,846 | $7,391 | $27,455 |
| 2014 | $9,540 | $34,846 | $7,391 | $27,455 |
| 2013 | $8,297 | $31,055 | $7,391 | $23,664 |
Source: Public Records
Map
Nearby Homes
- 1607 S Kaspar Ave
- 2234 S Crambourne Way
- 1515 S Harvard Ave
- 1355 S Dunton Ave
- 1107 W White Oak St
- 1535 S Douglas Ave
- 1114 S Fernandez Ave
- 2206 S Goebbert Rd Unit 409
- 5600 Astor Ln Unit 103
- 700 S Noah Terrace
- 1025 S Fernandez Ave Unit 3M
- 2121 W Haven St
- 1306 S New Wilke Rd Unit 2B
- 1322 S New Wilke Rd Unit 1C
- 1860 W Surrey Park Ln Unit 1C
- 5451 Elizabeth Place Unit 906
- 1210 S Douglas Ave
- 2315 S Goebbert Rd Unit D209
- 1008 Arbor Ct
- 1016 Arbor Ct
- 1802 S Highland Ave
- 1810 S Highland Ave
- 1708 S Highland Ave
- 1803 S Ridge Dr
- 1805 S Ridge Dr
- 1712 S Highland Ave
- 1723 S Ridge Dr
- 1807 S Ridge Dr
- 1814 S Highland Ave
- 1719 S Ridge Dr
- 1818 S Highland Ave
- 1706 S Highland Ave
- 1715 S Ridge Dr
- 1811 S Ridge Dr
- 1809 S Highland Ave
- 1803 S Highland Ave
- 1815 S Highland Ave
- 1711 S Highland Ave
- 1704 S Highland Ave
- 1821 S Highland Ave