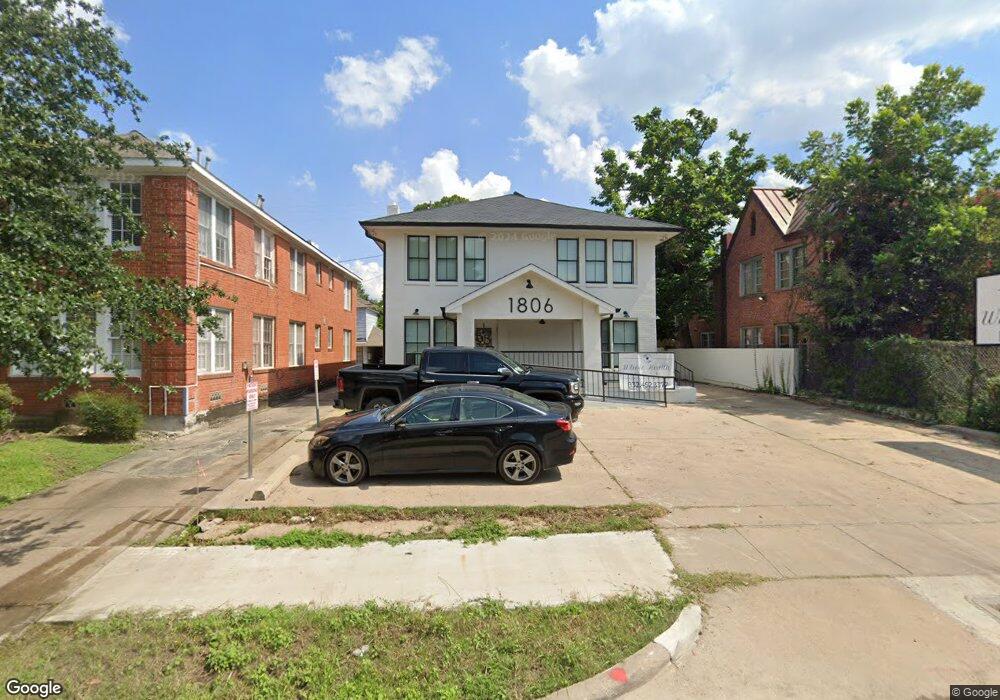
1806 W Alabama St Unit 3 Houston, TX 77098
Montrose NeighborhoodEstimated Value: $883,000 - $1,221,000
1
Bed
1
Bath
4,734
Sq Ft
$221/Sq Ft
Est. Value
About This Home
This home is located at 1806 W Alabama St Unit 3, Houston, TX 77098 and is currently estimated at $1,045,260, approximately $220 per square foot. 1806 W Alabama St Unit 3 is a home located in Harris County with nearby schools including Baker Montessori, Lanier Middle School, and Lamar High School.
Ownership History
Date
Name
Owned For
Owner Type
Purchase Details
Closed on
Oct 5, 2019
Sold by
Advisory Group Manager
Bought by
Tanase Cornelius A
Current Estimated Value
Purchase Details
Closed on
Apr 2, 2019
Sold by
Diaz Sheridan
Bought by
Tanase Cornelius A
Purchase Details
Closed on
Jun 1, 1999
Sold by
1806 Realty Inc
Bought by
Diaz Sheridan R and Diaz Sheridan
Home Financials for this Owner
Home Financials are based on the most recent Mortgage that was taken out on this home.
Original Mortgage
$228,000
Interest Rate
6.91%
Mortgage Type
Construction
Purchase Details
Closed on
Sep 1, 1995
Sold by
Bebout John W
Bought by
1806 Realty Inc
Home Financials for this Owner
Home Financials are based on the most recent Mortgage that was taken out on this home.
Original Mortgage
$55,000
Interest Rate
6.92%
Mortgage Type
Seller Take Back
Create a Home Valuation Report for This Property
The Home Valuation Report is an in-depth analysis detailing your home's value as well as a comparison with similar homes in the area
Home Values in the Area
Average Home Value in this Area
Purchase History
| Date | Buyer | Sale Price | Title Company |
|---|---|---|---|
| Tanase Cornelius A | -- | None Available | |
| Tanase Cornelius A | -- | None Available | |
| Diaz Sheridan R | -- | Commonwealth Land Title Co | |
| 1806 Realty Inc | -- | -- |
Source: Public Records
Mortgage History
| Date | Status | Borrower | Loan Amount |
|---|---|---|---|
| Previous Owner | Diaz Sheridan R | $228,000 | |
| Previous Owner | 1806 Realty Inc | $55,000 |
Source: Public Records
Tax History Compared to Growth
Tax History
| Year | Tax Paid | Tax Assessment Tax Assessment Total Assessment is a certain percentage of the fair market value that is determined by local assessors to be the total taxable value of land and additions on the property. | Land | Improvement |
|---|---|---|---|---|
| 2025 | $13,936 | $994,783 | $718,750 | $276,033 |
| 2024 | $13,936 | $948,701 | $718,750 | $229,951 |
| 2023 | $13,936 | $809,577 | $718,750 | $90,827 |
| 2022 | $12,009 | $545,379 | $531,250 | $14,129 |
| 2021 | $12,799 | $549,173 | $531,250 | $17,923 |
| 2020 | $15,380 | $635,104 | $531,250 | $103,854 |
| 2019 | $17,275 | $682,673 | $531,250 | $151,423 |
| 2018 | $16,953 | $669,945 | $531,250 | $138,695 |
| 2017 | $17,640 | $664,768 | $531,250 | $133,518 |
| 2016 | $17,246 | $649,937 | $531,250 | $118,687 |
| 2015 | $14,344 | $527,593 | $406,250 | $121,343 |
| 2014 | $14,344 | $532,104 | $412,500 | $119,604 |
Source: Public Records
Map
Nearby Homes
- 1824 Marshall St
- 1817 Kipling St
- 1842 W Alabama St
- 1841 Marshall St Unit 4
- 1755 Kipling St
- 1844 W Alabama St
- 1849 Marshall St Unit 9
- 1849 Marshall St Unit 19
- 1802 Kipling St
- 1723 Marshall St
- 1819 Branard St
- 3902 Hazard St
- 1737 Branard St
- 1912 Kipling St
- 1924 Kipling St
- 1660 Kipling St
- 1829 W Main St Unit C
- 1818 Colquitt St
- 1849 W Main St Unit 15
- 1640 Sul Ross St
- 1806 W Alabama St Unit 5
- 1806 W Alabama St Unit 4
- 1806 W Alabama St Unit 1
- 1810 W Alabama St Unit 4
- 1810 W Alabama St Unit 3
- 1810 W Alabama St Unit 5
- 1810 W Alabama St Unit 1
- 1810 W Alabama St Unit 1/2
- 1810 W Alabama St Unit 2
- 1810 W Alabama St Unit GarApt
- 1810 W Alabama St
- 1802 W Alabama St
- 1810/1812 W Alabama
- 1812 W Alabama St Unit 2
- 1812 W Alabama St Unit 1
- 1812 W Alabama St Unit 4
- 1812 W Alabama St Unit 3
- 1807 Marshall St
- 1818 W Alabama St
- 1813 Marshall St