Estimated Value: $2,467,056
Studio
2
Baths
5,120
Sq Ft
$482/Sq Ft
Est. Value
About This Home
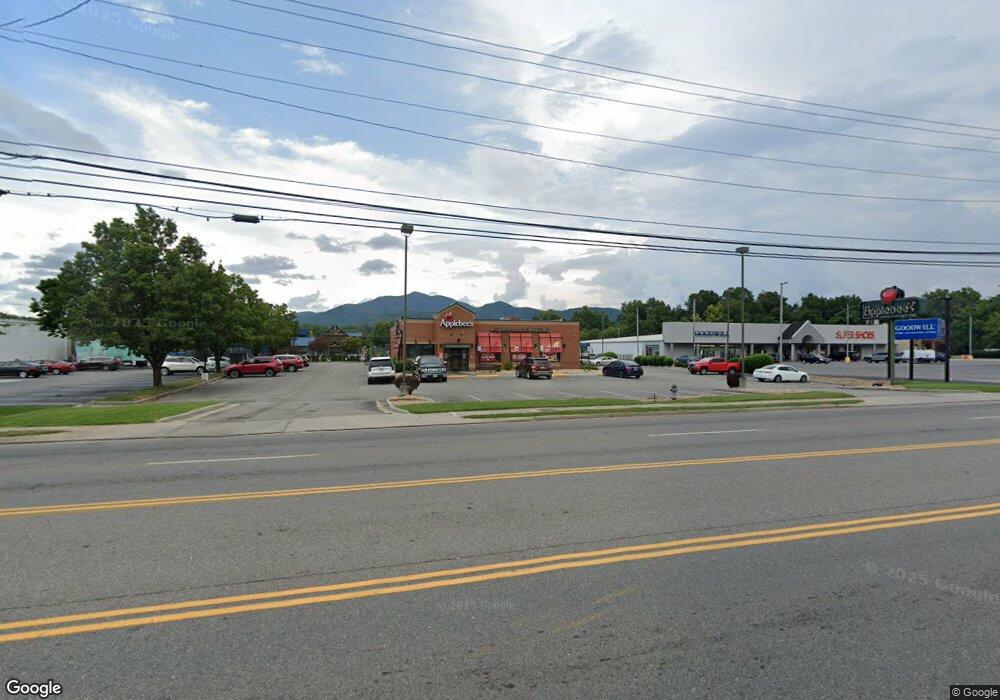
This home is located at 1806 W Main St, Salem, VA 24153 and is currently estimated at $2,467,056, approximately $481 per square foot. 1806 W Main St is a home located in Salem City with nearby schools including West Salem Elementary School, Andrew Lewis Middle School, and Salem High School.
Ownership History
Date
Name
Owned For
Owner Type
Purchase Details
Closed on
Dec 13, 2018
Sold by
Aigp Realty Llc
Bought by
Swami Real Estate Mky Llc
Current Estimated Value
Purchase Details
Closed on
Oct 19, 2018
Sold by
Patel Anand K
Bought by
Aigp Realty Llc
Purchase Details
Closed on
Nov 16, 2010
Sold by
Applebees Restaurants Mid Atlantic Llc
Bought by
Aig Virginia Llc
Purchase Details
Closed on
Dec 2, 2007
Sold by
Neal John R and Neal Linda M
Bought by
Jrn Inc
Home Financials for this Owner
Home Financials are based on the most recent Mortgage that was taken out on this home.
Original Mortgage
$8,000,000
Interest Rate
6.27%
Mortgage Type
Commercial
Create a Home Valuation Report for This Property
The Home Valuation Report is an in-depth analysis detailing your home's value as well as a comparison with similar homes in the area
Home Values in the Area
Average Home Value in this Area
Purchase History
| Date | Buyer | Sale Price | Title Company |
|---|---|---|---|
| Swami Real Estate Mky Llc | $1,500,000 | Stewart Title Guaranty Compa | |
| Aigp Realty Llc | -- | Stewart Title & Settlement | |
| Patel Anand K | -- | Stewart Title & Settlement | |
| Apple Investors Group Llc | -- | Stewart Title & Settlement | |
| Aig Virginia Llc | -- | None Available | |
| Jrn Inc | -- | None Available |
Source: Public Records
Mortgage History
| Date | Status | Borrower | Loan Amount |
|---|---|---|---|
| Previous Owner | Jrn Inc | $8,000,000 |
Source: Public Records
Tax History
| Year | Tax Paid | Tax Assessment Tax Assessment Total Assessment is a certain percentage of the fair market value that is determined by local assessors to be the total taxable value of land and additions on the property. | Land | Improvement |
|---|---|---|---|---|
| 2025 | $8,231 | $1,395,100 | $696,700 | $698,400 |
| 2024 | $7,997 | $1,332,900 | $671,900 | $661,000 |
| 2023 | $15,022 | $1,251,800 | $620,200 | $631,600 |
| 2022 | $13,517 | $1,126,400 | $584,100 | $542,300 |
| 2021 | $13,103 | $1,091,900 | $568,500 | $523,400 |
| 2020 | $12,949 | $1,079,100 | $542,700 | $536,400 |
| 2019 | $12,949 | $1,079,100 | $542,700 | $536,400 |
| 2018 | $12,733 | $1,079,100 | $542,700 | $536,400 |
| 2017 | $12,147 | $1,029,400 | $493,000 | $536,400 |
| 2016 | $11,952 | $1,012,900 | $476,500 | $536,400 |
| 2015 | $11,952 | $1,012,900 | $476,500 | $536,400 |
| 2014 | $11,952 | $1,012,900 | $476,500 | $536,400 |
Source: Public Records
Map
Nearby Homes
- 1407 Longview Ave
- 1927 Kiska Rd
- 1724 Starview Dr
- 1500 Ashley Dr
- 150 Fort Lewis Blvd
- 1541 Penley Blvd
- 2120 River Oaks Dr
- 1633 Millwood Dr
- 36 N Bruffey St
- 402 Goodwin Ave
- 1604 Melbourne Dr
- 1705 Brad Ct
- 2158 River Oaks Dr
- 2324 Foxfield Ln
- 2356 W Riverside Dr
- 2229 River Oaks Dr
- 2409 Rollingwood Dr
- Lot 6 Om Ln
- 335 Fort Lewis Blvd
- 1744 High Gate Ln
Your Personal Tour Guide
Ask me questions while you tour the home.