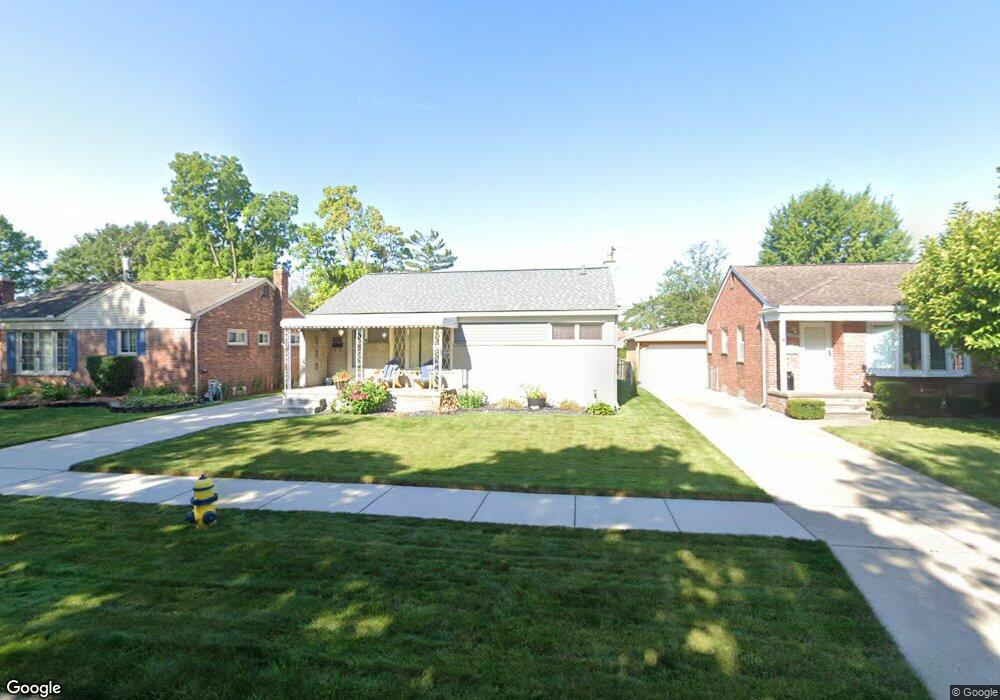
18062 Koester St Riverview, MI 48193
Estimated Value: $193,541 - $215,000
3
Beds
1
Bath
1,100
Sq Ft
$188/Sq Ft
Est. Value
About This Home
This home is located at 18062 Koester St, Riverview, MI 48193 and is currently estimated at $206,385, approximately $187 per square foot. 18062 Koester St is a home located in Wayne County with nearby schools including Riverview Community High School and St. Cyprian Elementary School.
Ownership History
Date
Name
Owned For
Owner Type
Purchase Details
Closed on
Dec 13, 2021
Sold by
Gilliam Brian W
Bought by
Gilliam Jennifer K
Current Estimated Value
Purchase Details
Closed on
Sep 7, 2010
Sold by
Nova Star Asset Management Llc
Bought by
Gilliam Brian W and Gilliam Jennifer K
Home Financials for this Owner
Home Financials are based on the most recent Mortgage that was taken out on this home.
Original Mortgage
$74,003
Interest Rate
4.5%
Mortgage Type
FHA
Purchase Details
Closed on
May 13, 2009
Sold by
Coffee Brad M and Coffee Kristen L
Bought by
Hsbc Bank Usa National Association
Purchase Details
Closed on
Aug 13, 2007
Sold by
Coffee Kristen Lynn
Bought by
Coffee Brad Michael
Purchase Details
Closed on
Mar 9, 1998
Sold by
Hone Janet P and Hone Kenneth H
Bought by
Coffee Brad M and Coffee Kristen L
Create a Home Valuation Report for This Property
The Home Valuation Report is an in-depth analysis detailing your home's value as well as a comparison with similar homes in the area
Home Values in the Area
Average Home Value in this Area
Purchase History
| Date | Buyer | Sale Price | Title Company |
|---|---|---|---|
| Gilliam Jennifer K | -- | None Listed On Document | |
| Gilliam Brian W | $75,000 | None Available | |
| Hsbc Bank Usa National Association | $34,650 | None Available | |
| Coffee Brad Michael | -- | None Available | |
| Coffee Brad M | $106,500 | -- |
Source: Public Records
Mortgage History
| Date | Status | Borrower | Loan Amount |
|---|---|---|---|
| Previous Owner | Gilliam Brian W | $74,003 |
Source: Public Records
Tax History
| Year | Tax Paid | Tax Assessment Tax Assessment Total Assessment is a certain percentage of the fair market value that is determined by local assessors to be the total taxable value of land and additions on the property. | Land | Improvement |
|---|---|---|---|---|
| 2025 | $1,789 | $89,500 | $0 | $0 |
| 2024 | $1,822 | $81,300 | $0 | $0 |
| 2023 | $1,649 | $74,700 | $0 | $0 |
| 2022 | $2,222 | $66,700 | $0 | $0 |
| 2021 | $2,085 | $62,300 | $0 | $0 |
| 2020 | $2,062 | $58,700 | $0 | $0 |
| 2019 | $2,024 | $53,700 | $0 | $0 |
| 2018 | $1,292 | $45,100 | $0 | $0 |
| 2017 | $1,060 | $43,600 | $0 | $0 |
| 2016 | $1,788 | $44,400 | $0 | $0 |
| 2015 | $3,685 | $44,500 | $0 | $0 |
| 2013 | $3,570 | $36,300 | $0 | $0 |
| 2012 | $1,998 | $38,800 | $14,300 | $24,500 |
Source: Public Records
Map
Nearby Homes
- 18082 Ray St
- 18031 Hamann St
- 18055 Hinton St
- 18616 Koester St
- VACANT Sibley Rd
- 0000 Fort St
- 11930 Garfield St
- 48 Cleveland St
- 54 Cleveland St
- 17486 Poplar St
- 14749 Williamsburg Dr
- 214 Detroit St
- 11531 Grant St
- 259 Detroit St
- 13842 Heritage St
- 14851 Williamsburg Dr
- 18765 Riverview St
- 14801 Pennsylvania Rd
- 4307 19th St
- 4413 18th St
- 18052 Koester St
- 18072 Koester St
- 18042 Koester St
- 18082 Koester St
- 18032 Koester St
- 18092 Koester St
- 18061 Koester St
- 18071 Koester St
- 18051 Koester St
- 18081 Koester St
- 18041 Koester St
- 18022 Koester St
- 18102 Koester St
- 18091 Koester St
- 18031 Koester St
- 18073 Ray St
- 18055 Ray St
- 18099 Ray St
- 13405 Longsdorf St
- 18112 Koester St
Your Personal Tour Guide
Ask me questions while you tour the home.