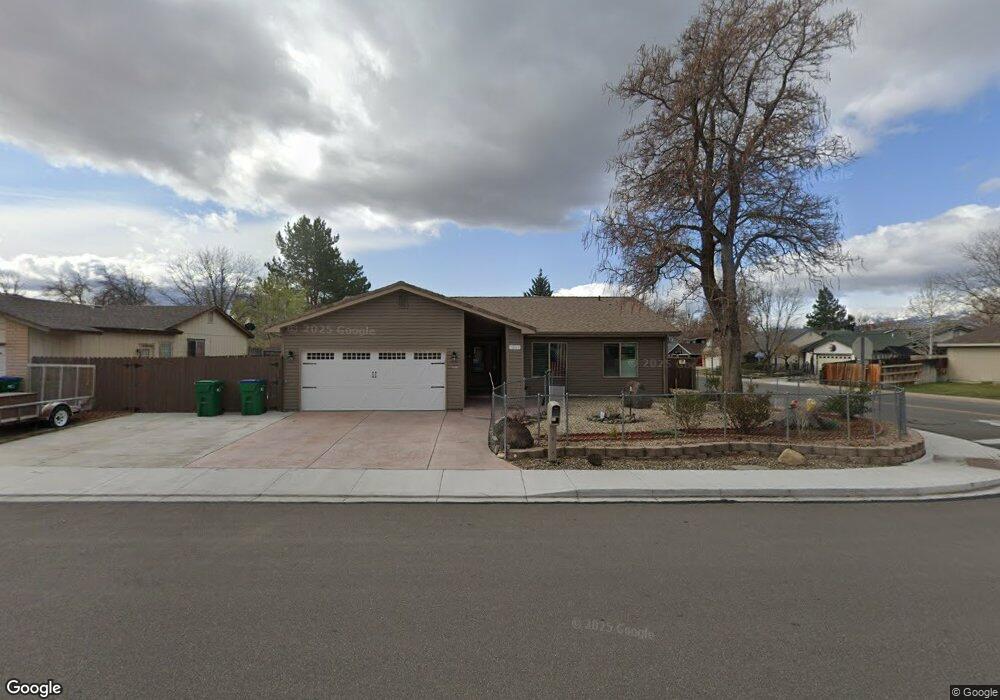
1807 Fieldcrest Dr Sparks, NV 89434
Reed NeighborhoodEstimated Value: $426,000 - $473,952
3
Beds
2
Baths
1,616
Sq Ft
$281/Sq Ft
Est. Value
About This Home
This home is located at 1807 Fieldcrest Dr, Sparks, NV 89434 and is currently estimated at $453,988, approximately $280 per square foot. 1807 Fieldcrest Dr is a home located in Washoe County with nearby schools including Lloyd Diedrichsen Elementary School, Lou Mendive Middle School, and Edward C Reed High School.
Ownership History
Date
Name
Owned For
Owner Type
Purchase Details
Closed on
Jun 14, 2005
Sold by
Talbott Larry F and Talbott Sherry L
Bought by
Grogan Joseph F and Grogan Luz M
Current Estimated Value
Home Financials for this Owner
Home Financials are based on the most recent Mortgage that was taken out on this home.
Original Mortgage
$295,000
Outstanding Balance
$82,782
Interest Rate
5.72%
Mortgage Type
Fannie Mae Freddie Mac
Estimated Equity
$371,206
Purchase Details
Closed on
Jul 27, 1995
Sold by
Snell Franklin D and Snell Deanna D
Bought by
Talbott Larry F and Talbott Sherry L
Home Financials for this Owner
Home Financials are based on the most recent Mortgage that was taken out on this home.
Original Mortgage
$134,772
Interest Rate
7.62%
Mortgage Type
FHA
Create a Home Valuation Report for This Property
The Home Valuation Report is an in-depth analysis detailing your home's value as well as a comparison with similar homes in the area
Home Values in the Area
Average Home Value in this Area
Purchase History
| Date | Buyer | Sale Price | Title Company |
|---|---|---|---|
| Grogan Joseph F | $320,000 | Stewart Title Of Northern Nv | |
| Talbott Larry F | $137,500 | Western Title Company Inc |
Source: Public Records
Mortgage History
| Date | Status | Borrower | Loan Amount |
|---|---|---|---|
| Open | Grogan Joseph F | $295,000 | |
| Previous Owner | Talbott Larry F | $134,772 |
Source: Public Records
Tax History
| Year | Tax Paid | Tax Assessment Tax Assessment Total Assessment is a certain percentage of the fair market value that is determined by local assessors to be the total taxable value of land and additions on the property. | Land | Improvement |
|---|---|---|---|---|
| 2026 | $884 | $83,052 | $36,890 | $46,162 |
| 2025 | $1,147 | $83,481 | $36,120 | $47,361 |
| 2024 | $1,147 | $81,340 | $33,215 | $48,125 |
| 2023 | $1,116 | $81,131 | $35,175 | $45,956 |
| 2022 | $1,135 | $65,311 | $26,740 | $38,571 |
| 2021 | $1,119 | $60,404 | $21,735 | $38,669 |
| 2020 | $878 | $48,045 | $20,720 | $27,325 |
| 2019 | $832 | $47,608 | $20,720 | $26,888 |
| 2018 | $1,404 | $40,717 | $14,455 | $26,262 |
| 2017 | $915 | $40,449 | $13,720 | $26,729 |
| 2016 | $946 | $39,909 | $12,250 | $27,659 |
| 2015 | $946 | $38,703 | $10,325 | $28,378 |
| 2014 | $924 | $36,743 | $9,030 | $27,713 |
| 2013 | -- | $34,507 | $6,860 | $27,647 |
Source: Public Records
Map
Nearby Homes
- 2688 Laguna Way
- 2425 Desert Flower Ct
- 2532 Napoli Dr
- 1701 Clover Leaf Dr
- 2624 Sunny Slope Dr Unit 10
- 3055 S Cottage Dr
- 2625 Sunny Slope Dr
- 2625 Sunny Slope Dr Unit 2
- 3224 Danville Dr
- 2627 Sunny Slope Dr Unit 5
- 2158 Capri Ln
- 1360 Del Rosa Way
- 2037 Meritage Ct Unit 1
- 3174 Myles Dr
- 2407 Sunny Slope Dr Unit 1
- 3295 Modena Dr
- 2655 Sycamore Glen Dr Unit 1
- 3290 Modena Dr
- 1800 Cosenza Dr
- 1741 Medolla Dr
- 1817 Fieldcrest Dr
- 2764 Blossom View Dr
- 1777 Fieldcrest Dr
- 1827 Fieldcrest Dr
- 2654 Blossom View Dr
- 1808 Fieldcrest Dr
- 2653 Drexel Way
- 1818 Fieldcrest Dr
- 1837 Fieldcrest Dr
- 1767 Fieldcrest Dr
- 1778 Fieldcrest Dr
- 2653 Blossom View Dr
- 1828 Fieldcrest Dr
- 2614 Blossom View Dr
- 2672 Drexel Way
- 2613 Drexel Way
- 1664 Round Mountain Cir
- 1666 Round Mountain Cir
- 1758 Fieldcrest Dr
- 1838 Fieldcrest Dr
Your Personal Tour Guide
Ask me questions while you tour the home.