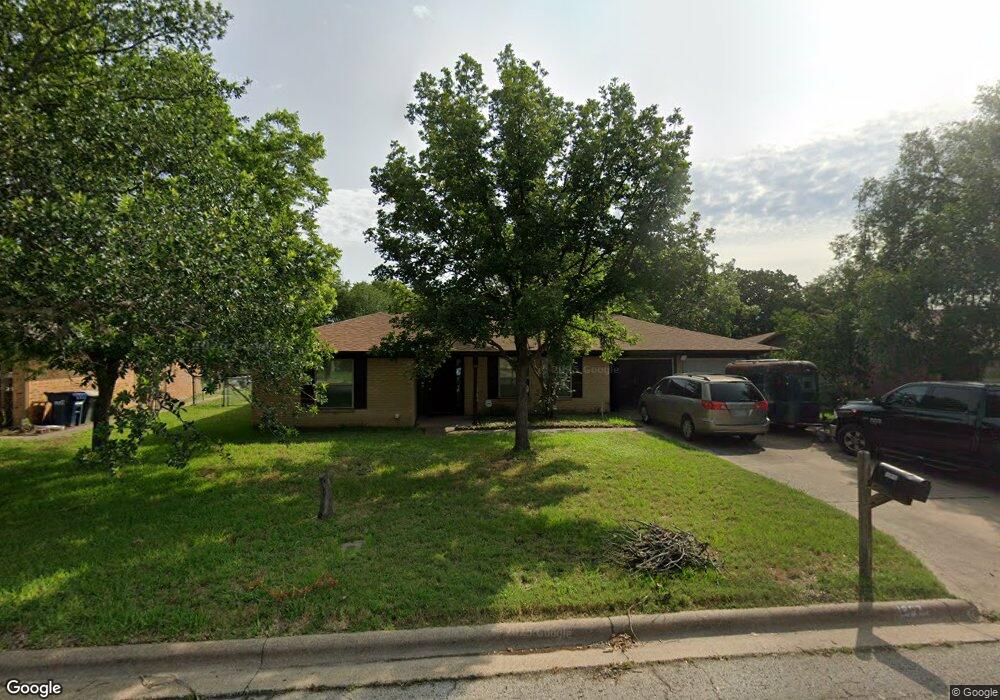
1807 Laura Ln College Station, TX 77840
South Knoll NeighborhoodEstimated Value: $256,771 - $280,000
3
Beds
2
Baths
1,604
Sq Ft
$170/Sq Ft
Est. Value
About This Home
This home is located at 1807 Laura Ln, College Station, TX 77840 and is currently estimated at $272,943, approximately $170 per square foot. 1807 Laura Ln is a home located in Brazos County with nearby schools including South Knoll Elementary School, A&M Consolidated Middle School, and Oakwood Intermediate School.
Ownership History
Date
Name
Owned For
Owner Type
Purchase Details
Closed on
Oct 2, 2025
Sold by
Holt Grant A
Bought by
Carson Christopher and Carson Katherine
Current Estimated Value
Purchase Details
Closed on
Oct 1, 2025
Sold by
Mcdonald Karen S
Bought by
Carson Christopher and Carson Katherine
Purchase Details
Closed on
Sep 25, 2025
Sold by
Holt Gregory A
Bought by
Carson Scott and Carson Katherine
Purchase Details
Closed on
Jun 19, 2025
Sold by
Holt Amos E
Bought by
Holt Gregory A and Mcdonald Karen S
Purchase Details
Closed on
Aug 25, 2022
Sold by
Holt Amos E
Bought by
Holt Amos E
Purchase Details
Closed on
Aug 14, 2006
Sold by
Davis Thomas M and Davis Thomas G
Bought by
Holt Amos E and Holt Carolyn S
Home Financials for this Owner
Home Financials are based on the most recent Mortgage that was taken out on this home.
Original Mortgage
$100,700
Interest Rate
6.77%
Mortgage Type
New Conventional
Create a Home Valuation Report for This Property
The Home Valuation Report is an in-depth analysis detailing your home's value as well as a comparison with similar homes in the area
Home Values in the Area
Average Home Value in this Area
Purchase History
| Date | Buyer | Sale Price | Title Company |
|---|---|---|---|
| Carson Christopher | -- | None Listed On Document | |
| Carson Christopher | -- | None Listed On Document | |
| Carson Scott | -- | None Listed On Document | |
| Holt Gregory A | -- | None Listed On Document | |
| Holt Amos E | -- | None Listed On Document | |
| Holt Amos E | -- | University Title Company |
Source: Public Records
Mortgage History
| Date | Status | Borrower | Loan Amount |
|---|---|---|---|
| Previous Owner | Holt Amos E | $100,700 |
Source: Public Records
Tax History Compared to Growth
Tax History
| Year | Tax Paid | Tax Assessment Tax Assessment Total Assessment is a certain percentage of the fair market value that is determined by local assessors to be the total taxable value of land and additions on the property. | Land | Improvement |
|---|---|---|---|---|
| 2025 | $5,051 | $263,962 | $59,000 | $204,962 |
| 2024 | $5,051 | $265,032 | $57,750 | $207,282 |
| 2023 | $5,051 | $283,200 | $57,750 | $225,450 |
| 2022 | $4,694 | $220,151 | $52,500 | $167,651 |
| 2021 | $4,454 | $197,193 | $52,500 | $144,693 |
| 2020 | $4,065 | $179,008 | $52,500 | $126,508 |
| 2019 | $4,149 | $175,590 | $50,000 | $125,590 |
| 2018 | $4,180 | $175,590 | $50,000 | $125,590 |
| 2017 | $3,778 | $160,520 | $50,000 | $110,520 |
| 2016 | $3,519 | $149,530 | $40,000 | $109,530 |
| 2015 | $3,248 | $145,970 | $40,000 | $105,970 |
| 2014 | $3,248 | $140,130 | $40,000 | $100,130 |
Source: Public Records
Map
Nearby Homes
- 1801 Langford St
- 1810 Laura Ln
- 1817 Laura Ln
- 1818 Langford St
- 1712 Glade St
- 1700 Laura Ln Unit CS
- 1205 King Arthur Cir
- 1601 Langford St
- 1808 Potomac Place Unit AD
- 1808 Potomac Place Unit A
- 1810 Potomac Place Unit AD
- 1502 Glade St
- 1305 Laura Ln Unit CS
- 2004 Angelina Cir
- 1208 N Ridgefield Cir
- 2148 Big River St
- 2142 Big River St
- 2144 Big River St
- 2156 Big River St
- 2146 Big River St
- 1809 Laura Ln
- 1811 Laura Ln
- 1803 Laura Ln
- 1806 Southwood Dr
- 1804 Southwood Dr
- 1806 Laura Ln
- 1808 Laura Ln
- 1808 Southwood Dr
- 1804 Laura Ln
- 1802 Southwood Dr
- 1801 Laura Ln
- 1812 Laura Ln
- 1802 Laura Ln
- 1810 Southwood Dr
- 1800 Southwood Dr
- 1814 Laura Ln
- 1815 Laura Ln
- 1800 Laura Ln
- 1809 Langford St
- 1807 Langford St