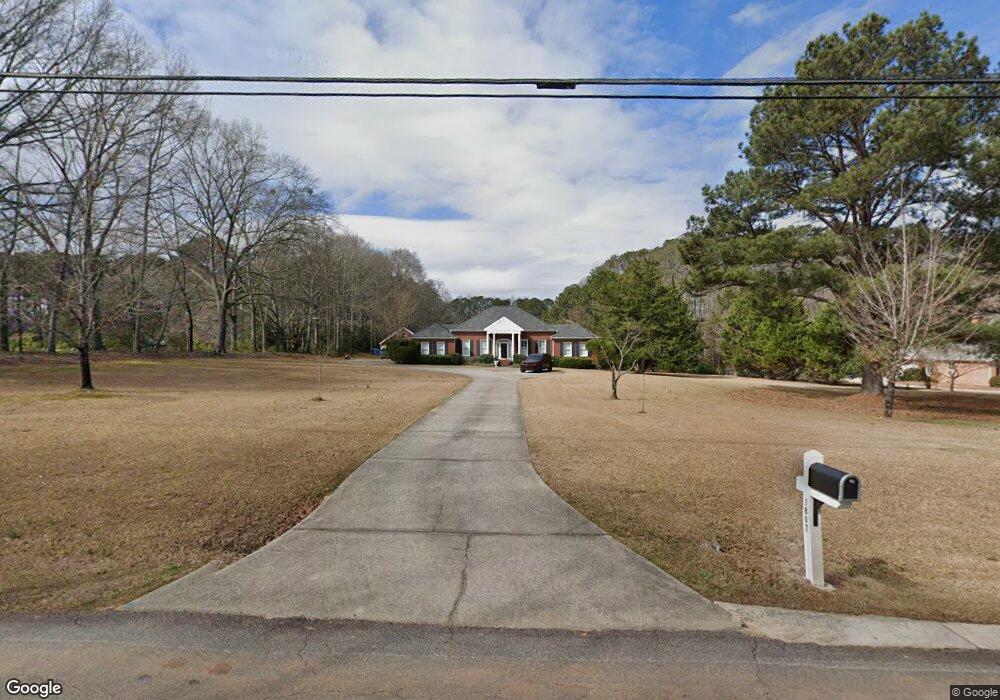
1807 Maple Dr Griffin, GA 30224
Spalding County NeighborhoodEstimated Value: $457,000 - $719,000
5
Beds
3
Baths
3,204
Sq Ft
$171/Sq Ft
Est. Value
About This Home
This home is located at 1807 Maple Dr, Griffin, GA 30224 and is currently estimated at $548,959, approximately $171 per square foot. 1807 Maple Dr is a home located in Spalding County with nearby schools including Crescent Road Elementary School, Rehoboth Road Middle School, and Spalding High School.
Ownership History
Date
Name
Owned For
Owner Type
Purchase Details
Closed on
Apr 4, 2011
Sold by
Langford Betty J T
Bought by
White Kimberly M and White Scott G
Current Estimated Value
Home Financials for this Owner
Home Financials are based on the most recent Mortgage that was taken out on this home.
Original Mortgage
$180,400
Outstanding Balance
$125,156
Interest Rate
4.92%
Mortgage Type
New Conventional
Estimated Equity
$423,803
Purchase Details
Closed on
Mar 18, 1992
Sold by
Gaston Richard and Gaston Jane
Bought by
Langford Betty Jo Tyus and Langford Gwendolyn
Purchase Details
Closed on
Jun 14, 1989
Sold by
Allen Samule E and Kendrick Constance A
Bought by
Carlisle John R
Purchase Details
Closed on
Mar 27, 1989
Sold by
Carlisle John R
Bought by
Gaston Richard and Gaston Jane
Purchase Details
Closed on
Mar 14, 1989
Sold by
Allen Mrs Clara
Bought by
Allen Samuel E and Kendri Constance A
Create a Home Valuation Report for This Property
The Home Valuation Report is an in-depth analysis detailing your home's value as well as a comparison with similar homes in the area
Home Values in the Area
Average Home Value in this Area
Purchase History
| Date | Buyer | Sale Price | Title Company |
|---|---|---|---|
| White Kimberly M | $225,600 | -- | |
| Langford Betty Jo Tyus | $25,000 | -- | |
| Carlisle John R | -- | -- | |
| Gaston Richard | $25,000 | -- | |
| Allen Samuel E | -- | -- |
Source: Public Records
Mortgage History
| Date | Status | Borrower | Loan Amount |
|---|---|---|---|
| Open | White Kimberly M | $180,400 |
Source: Public Records
Tax History Compared to Growth
Tax History
| Year | Tax Paid | Tax Assessment Tax Assessment Total Assessment is a certain percentage of the fair market value that is determined by local assessors to be the total taxable value of land and additions on the property. | Land | Improvement |
|---|---|---|---|---|
| 2024 | $6,097 | $160,343 | $10,400 | $149,943 |
| 2023 | $5,748 | $146,194 | $10,400 | $135,794 |
| 2022 | $5,021 | $125,635 | $8,000 | $117,635 |
| 2021 | $4,052 | $103,746 | $8,000 | $95,746 |
| 2020 | $3,720 | $95,448 | $8,000 | $87,448 |
| 2019 | $3,927 | $98,842 | $8,000 | $90,842 |
| 2018 | $3,780 | $91,860 | $8,000 | $83,860 |
| 2017 | $3,699 | $91,860 | $8,000 | $83,860 |
| 2016 | $3,759 | $91,860 | $8,000 | $83,860 |
| 2015 | $3,820 | $91,860 | $8,000 | $83,860 |
| 2014 | $4,287 | $99,860 | $16,000 | $83,860 |
Source: Public Records
Map
Nearby Homes
- 3000 Ext S 6th St
- 174 Grange Rd
- 0 Sweetbriar Ln Unit B 20110670
- 1013 Waverly Dr
- 1011 Waverly Dr
- 1058 Waverly Dr
- LOT 48 Waverly Dr Unit 1
- LOT 47 Waverly Dr Unit 1
- LOT 69 Waverly Dr Unit 1
- LOT 68 Waverly Dr Unit 1
- LOT 67 Waverly Dr Unit 1
- LOT 66 Waverly Dr Unit 1
- LOT 65 Waverly Dr Unit 1
- LOT 46 Waverly Dr Unit 1
- LOT 45 Waverly Dr Unit 1
- LOT 44 Waverly Dr Unit 1
- LOT 43 Waverly Dr Unit 1
- LOT 42 Waverly Dr Unit 1
- LOT 40 Waverly Dr Unit 1
- LOT 39 Waverly Dr Unit 1
- 0 Highway 41 and Shackleford Firetower Rd Unit 7178076
- 1809 Maple Dr
- 0 T D Hunter Rd Unit D
- 312 Cedarville
- 311 S Twelth St
- T D Hunter Rd Unit D
- 1808 Maple Dr
- 205 Maplewood Cir Unit 1
- 203 Maplewood Cir
- 737 Maddox Rd
- 206 Maplewood Cir
- 103 Maplewood Dr
- 100 Cumberland Rd
- 733 Maddox Rd
- 1803 Maple Dr
- 1780 Maple Dr
- 105 Maplewood Dr
- 204 Maplewood Cir
- 0 Maplewood Cir Unit 8321020
- 0 Maplewood Cir