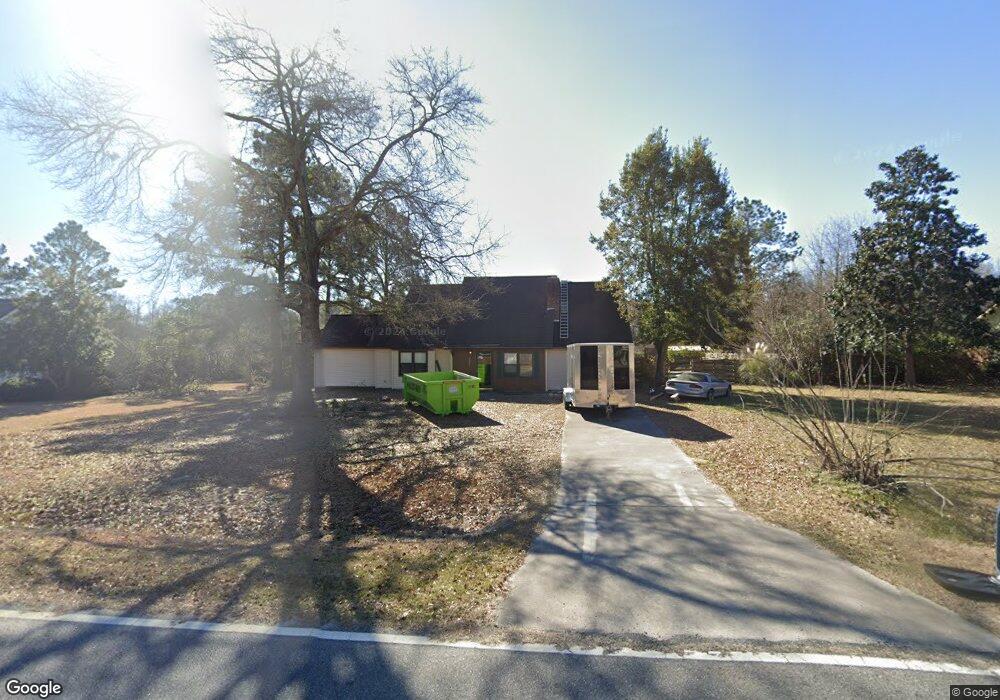
1807 Moses Dr Vidalia, GA 30474
Estimated Value: $171,000 - $222,000
4
Beds
2
Baths
1,850
Sq Ft
$112/Sq Ft
Est. Value
About This Home
This home is located at 1807 Moses Dr, Vidalia, GA 30474 and is currently estimated at $206,352, approximately $111 per square foot. 1807 Moses Dr is a home located in Toombs County with nearby schools including J.D. Dickerson Primary School, Sally Dailey Meadows Elementary School, and J.R. Trippe Middle School.
Ownership History
Date
Name
Owned For
Owner Type
Purchase Details
Closed on
Sep 8, 2009
Sold by
Sikes Sherry Darlene
Bought by
Hower Richard Lawrence
Current Estimated Value
Home Financials for this Owner
Home Financials are based on the most recent Mortgage that was taken out on this home.
Original Mortgage
$120,000
Interest Rate
5.22%
Mortgage Type
New Conventional
Purchase Details
Closed on
Aug 24, 2007
Sold by
Powers Patricia M
Bought by
Sikes Sherry Darlene
Home Financials for this Owner
Home Financials are based on the most recent Mortgage that was taken out on this home.
Original Mortgage
$135,710
Interest Rate
6.65%
Mortgage Type
New Conventional
Purchase Details
Closed on
Nov 19, 1999
Sold by
Sammons Kevin L
Bought by
Powers James A
Purchase Details
Closed on
Feb 11, 1997
Bought by
Sammons Kevin L
Create a Home Valuation Report for This Property
The Home Valuation Report is an in-depth analysis detailing your home's value as well as a comparison with similar homes in the area
Home Values in the Area
Average Home Value in this Area
Purchase History
| Date | Buyer | Sale Price | Title Company |
|---|---|---|---|
| Hower Richard Lawrence | $120,000 | -- | |
| Sikes Sherry Darlene | $135,000 | -- | |
| Powers James A | $77,000 | -- | |
| Sammons Kevin L | -- | -- | |
| Sammons Kevin L | $65,000 | -- |
Source: Public Records
Mortgage History
| Date | Status | Borrower | Loan Amount |
|---|---|---|---|
| Closed | Hower Richard Lawrence | $120,000 | |
| Previous Owner | Sikes Sherry Darlene | $135,710 |
Source: Public Records
Tax History Compared to Growth
Tax History
| Year | Tax Paid | Tax Assessment Tax Assessment Total Assessment is a certain percentage of the fair market value that is determined by local assessors to be the total taxable value of land and additions on the property. | Land | Improvement |
|---|---|---|---|---|
| 2024 | $1,803 | $65,631 | $2,998 | $62,633 |
| 2023 | $1,731 | $61,691 | $2,998 | $58,693 |
| 2022 | $497 | $54,923 | $2,998 | $51,925 |
| 2021 | $456 | $48,202 | $2,998 | $45,204 |
| 2020 | $453 | $47,057 | $2,998 | $44,059 |
| 2019 | $453 | $47,057 | $2,998 | $44,059 |
| 2018 | $452 | $47,057 | $2,998 | $44,059 |
| 2017 | $437 | $44,792 | $2,998 | $41,794 |
| 2016 | $437 | $44,792 | $2,998 | $41,794 |
| 2015 | -- | $42,560 | $2,099 | $40,461 |
| 2014 | -- | $42,560 | $2,099 | $40,461 |
Source: Public Records
Map
Nearby Homes
- 1710 Aimwell Blvd
- 2006 Aimwell Rd Unit 1
- 2007 2007 Aimwell Rd
- 1505 Ridgeway Dr
- 1716 Center Dr
- 810 Estroff Dr
- 1236 Susan Way Unit 1238
- 807 Estroff Dr
- 804 Bloomfield Rd Unit 1
- 1407 N Cheney Dr
- 1206 Center Dr
- 00 Forest Hill Cir
- 801 E 5th St
- 803 Bay St
- 507 E 7th St
- 1100 Center Dr
- 1804 Anderson St
- 909 Center Dr
- 735 Bostwick Cir
- 907 Center Dr
- 1809 Moses Dr
- 1805 Moses Dr
- 1810 Aimwell Blvd
- 1808 Aimwell Blvd
- 1810 Moses Dr
- 1806 Aimwell Blvd
- 1804 Moses Dr
- 1811 Moses Dr
- 1801 Moses Dr
- 1816 Moses Dr
- 1804 Aimwell Blvd
- 1816 Aimwell Blvd
- 1811 Aimwell Blvd
- 1802 Aimwell Blvd
- 1813 Aimwell Blvd
- 1813B Aimwell Blvd
- 1716 Moses Dr
- 1713 Moses Dr
- 1815 Aimwell Blvd
- 1800 Aimwell Blvd