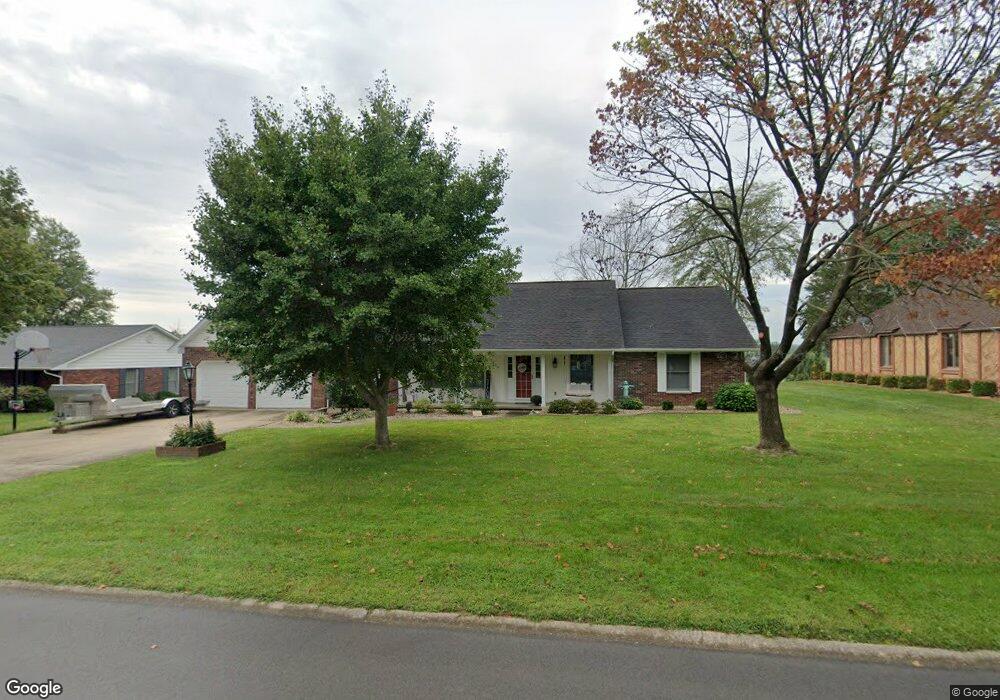
1807 Paula Ln Marion, IL 62959
Estimated Value: $268,000 - $331,000
3
Beds
2
Baths
2,430
Sq Ft
$123/Sq Ft
Est. Value
About This Home
This home is located at 1807 Paula Ln, Marion, IL 62959 and is currently estimated at $298,885, approximately $122 per square foot. 1807 Paula Ln is a home located in Williamson County with nearby schools including Longfellow Elementary School, Marion Junior High School, and Marion High School.
Ownership History
Date
Name
Owned For
Owner Type
Purchase Details
Closed on
May 10, 2021
Sold by
Dunaway Gary and Dunaway Margaret
Bought by
Dunaway Gary and Dunaway Margaret
Current Estimated Value
Purchase Details
Closed on
Mar 19, 2020
Sold by
Dana Anderson and Dana Brittney
Bought by
Dunaway Gary and Dunaway Margaret
Purchase Details
Closed on
Oct 22, 2019
Sold by
Jason Allison and Jason Wendy
Bought by
Anderson Dana and Anderson Brittney
Home Financials for this Owner
Home Financials are based on the most recent Mortgage that was taken out on this home.
Original Mortgage
$152,900
Interest Rate
5.5%
Mortgage Type
Construction
Purchase Details
Closed on
Sep 23, 2019
Sold by
William Jennings and William Jayne
Bought by
Allison Jason and Allison Wendy
Home Financials for this Owner
Home Financials are based on the most recent Mortgage that was taken out on this home.
Original Mortgage
$152,900
Interest Rate
5.5%
Mortgage Type
Construction
Create a Home Valuation Report for This Property
The Home Valuation Report is an in-depth analysis detailing your home's value as well as a comparison with similar homes in the area
Home Values in the Area
Average Home Value in this Area
Purchase History
| Date | Buyer | Sale Price | Title Company |
|---|---|---|---|
| Dunaway Gary | -- | Lawler Brown Law Firm | |
| Dunaway Gary | $215,500 | Lawler Brown Law Firm | |
| Anderson Dana | $118,500 | Lawler Brown Law Firm | |
| Allison Jason | -- | Lawler Brown Law Firm |
Source: Public Records
Mortgage History
| Date | Status | Borrower | Loan Amount |
|---|---|---|---|
| Previous Owner | Anderson Dana | $152,900 |
Source: Public Records
Tax History
| Year | Tax Paid | Tax Assessment Tax Assessment Total Assessment is a certain percentage of the fair market value that is determined by local assessors to be the total taxable value of land and additions on the property. | Land | Improvement |
|---|---|---|---|---|
| 2025 | $4,501 | $77,940 | $14,160 | $63,780 |
| 2024 | $5,247 | $77,940 | $14,160 | $63,780 |
| 2023 | $4,501 | $68,750 | $12,490 | $56,260 |
| 2022 | $4,260 | $72,370 | $13,150 | $59,220 |
| 2021 | $4,646 | $69,750 | $12,670 | $57,080 |
| 2020 | $4,646 | $65,900 | $11,970 | $53,930 |
| 2019 | $5,002 | $65,900 | $11,970 | $53,930 |
| 2018 | $5,002 | $65,900 | $11,970 | $53,930 |
| 2017 | $4,913 | $65,900 | $11,970 | $53,930 |
| 2015 | $4,760 | $62,420 | $11,340 | $51,080 |
| 2013 | $3,661 | $62,420 | $11,340 | $51,080 |
| 2012 | $3,661 | $62,420 | $11,340 | $51,080 |
Source: Public Records
Map
Nearby Homes
- 1800 Testa Dr
- 1502 Nagel Dr
- 2101 Windsor Dr
- 1713 Castleberry Dr
- 1303 S Carbon St
- 1605 S Eugene Ln
- 1902 Suzanne Dr
- 000 W Douglas Dr
- 1411 & 1413 W Hendrickson St
- 406 Charlotte Rd
- 1200 S Vicksburg St
- 1804 W Copeland St
- 505 S 2nd St
- 1200 S Court St
- 1219 S Court St
- 1615 W Chestnut St
- 1408 W Cherry St
- 2107 W Main St
- 7306 Norris Dr
- 409 S Hill St
Your Personal Tour Guide
Ask me questions while you tour the home.