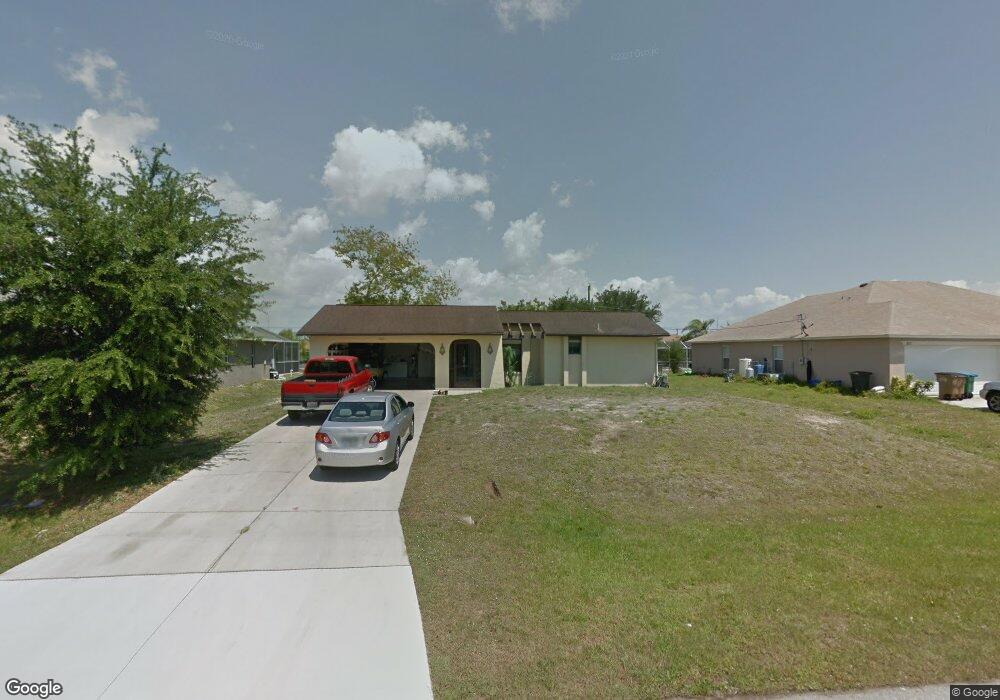
1807 SW 2nd Ave Cape Coral, FL 33991
Hancock NeighborhoodEstimated Value: $234,063 - $312,000
2
Beds
2
Baths
1,216
Sq Ft
$222/Sq Ft
Est. Value
About This Home
This home is located at 1807 SW 2nd Ave, Cape Coral, FL 33991 and is currently estimated at $269,516, approximately $221 per square foot. 1807 SW 2nd Ave is a home located in Lee County with nearby schools including Caloosa Elementary School, Cape Elementary School, and Tropic Isles Elementary School.
Ownership History
Date
Name
Owned For
Owner Type
Purchase Details
Closed on
Jun 23, 2022
Sold by
Nelson Dennis S
Bought by
630 1807 627 646 Llc
Current Estimated Value
Purchase Details
Closed on
Nov 10, 2011
Sold by
Alegria Amparo
Bought by
Nelson Dennis S
Purchase Details
Closed on
Aug 10, 2004
Sold by
Hinks Nancy R
Bought by
Alegria Amparo
Home Financials for this Owner
Home Financials are based on the most recent Mortgage that was taken out on this home.
Original Mortgage
$64,500
Interest Rate
3.98%
Mortgage Type
Unknown
Purchase Details
Closed on
Aug 28, 2003
Sold by
Torres Hugo
Bought by
Torres Hugo and Hinks Nancy
Purchase Details
Closed on
Jun 16, 2003
Sold by
Hinks Donald E
Bought by
Torres Hugo
Home Financials for this Owner
Home Financials are based on the most recent Mortgage that was taken out on this home.
Original Mortgage
$95,933
Interest Rate
5.68%
Purchase Details
Closed on
May 10, 2002
Sold by
Farrell Marie E and Farrell Francis J
Bought by
Hinks Donald E
Create a Home Valuation Report for This Property
The Home Valuation Report is an in-depth analysis detailing your home's value as well as a comparison with similar homes in the area
Home Values in the Area
Average Home Value in this Area
Purchase History
| Date | Buyer | Sale Price | Title Company |
|---|---|---|---|
| 630 1807 627 646 Llc | $100 | -- | |
| Nelson Dennis S | $51,900 | Townsend Title Insurance Age | |
| Alegria Amparo | $124,500 | Team Title Insurance Inc | |
| Torres Hugo | -- | -- | |
| Torres Hugo | $98,900 | -- | |
| Hinks Donald E | $4,500 | -- |
Source: Public Records
Mortgage History
| Date | Status | Borrower | Loan Amount |
|---|---|---|---|
| Previous Owner | Alegria Amparo | $64,500 | |
| Previous Owner | Torres Hugo | $95,933 | |
| Previous Owner | Torres Hugo | $105,000 |
Source: Public Records
Tax History Compared to Growth
Tax History
| Year | Tax Paid | Tax Assessment Tax Assessment Total Assessment is a certain percentage of the fair market value that is determined by local assessors to be the total taxable value of land and additions on the property. | Land | Improvement |
|---|---|---|---|---|
| 2025 | $4,873 | $162,471 | $66,215 | $96,256 |
| 2024 | $4,932 | $199,556 | $57,697 | $141,859 |
| 2023 | $4,932 | $203,592 | $70,305 | $133,287 |
| 2022 | $3,974 | $135,650 | $0 | $0 |
| 2021 | $3,718 | $133,319 | $28,000 | $105,319 |
| 2020 | $3,524 | $121,132 | $28,000 | $93,132 |
| 2019 | $3,378 | $119,517 | $25,500 | $94,017 |
| 2018 | $3,264 | $113,052 | $22,000 | $91,052 |
| 2017 | $3,130 | $104,976 | $12,000 | $92,976 |
| 2016 | $3,022 | $92,743 | $12,000 | $80,743 |
| 2015 | $2,883 | $83,104 | $9,500 | $73,604 |
| 2014 | -- | $71,595 | $6,580 | $65,015 |
| 2013 | -- | $59,705 | $4,800 | $54,905 |
Source: Public Records
Map
Nearby Homes
- 1813 SW 1st Ave
- 1817 SW 3rd Ave
- 1705 & 1707 SW 1st Ave
- 1822 SW Santa Barbara Place Unit 68
- 217 SW 17th St
- 213 SW 19th Terrace
- 1221 SW 3rd Ave
- 1825 SW 3rd Place
- 212 SW 19th Terrace
- 1816 SW 3rd Place
- 128 SW 19th Ln
- 31 SW 20th St
- 1941 SW Santa Barbara Place
- 1420 SW Santa Barbara Place
- 1424 SW Santa Barbara Place
- 1624 SW 4th St
- 216 SW 20th St
- 109 SW 15th Terrace
- 1937 SW Santa Barbara Place
- 411 SW 19th Terrace
- 1803 SW 2nd Ave Unit 13
- 1803 SW 2nd Ave
- 1811 SW 2nd Ave
- 1806 SW 1st Place
- 1806 SW 1st Place
- 1810 SW 1st Place
- 1727 SW 2nd Ave
- 1815 SW 2nd Ave
- 1806 SW 2nd Ave
- 1802 SW 2nd Ave
- 1810 SW 2nd Ave
- 1726 SW 1st Place
- 1814 SW 1st Place
- 1723 SW 2nd Ave
- 1726 SW 2nd Ave
- 1819 SW 2nd Ave
- 1722 SW 1st Place
- 1818 SW 2nd Ave
- 1818 SW 1st Place