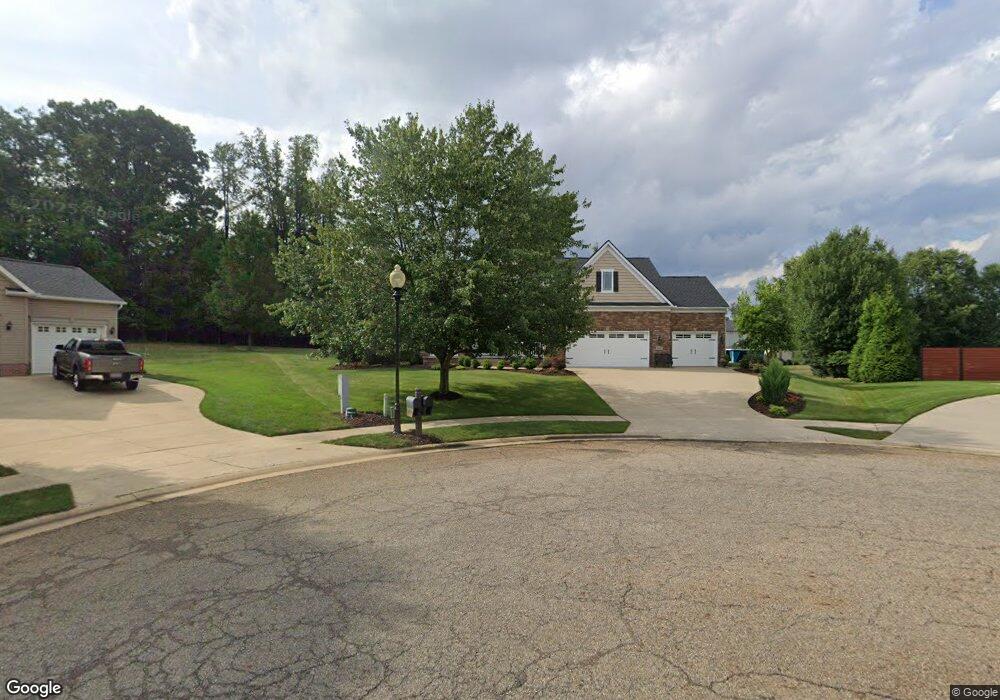
1807 Swanhurst Cir NE North Canton, OH 44720
Estimated Value: $447,000 - $470,288
4
Beds
3
Baths
2,402
Sq Ft
$192/Sq Ft
Est. Value
About This Home
This home is located at 1807 Swanhurst Cir NE, North Canton, OH 44720 and is currently estimated at $460,822, approximately $191 per square foot. 1807 Swanhurst Cir NE is a home located in Stark County with nearby schools including Middlebranch Elementary School, Oakwood Middle School, and GlenOak High School.
Ownership History
Date
Name
Owned For
Owner Type
Purchase Details
Closed on
Oct 31, 2022
Sold by
Russell John Samuel
Bought by
Russell John Samuel and Russell Lori A
Current Estimated Value
Purchase Details
Closed on
Jan 28, 2012
Sold by
Egersdorfer Melissa A and Marion Wendy J
Bought by
Russell John Samuel
Purchase Details
Closed on
Jun 5, 2007
Sold by
Dutch Heritage Homes Inc
Bought by
Egersdorfer Melissa A and Marion Wendy J
Home Financials for this Owner
Home Financials are based on the most recent Mortgage that was taken out on this home.
Original Mortgage
$254,150
Interest Rate
5.75%
Mortgage Type
Purchase Money Mortgage
Purchase Details
Closed on
Feb 11, 2004
Sold by
Lemmon & Lemmon Inc
Bought by
Mckinley Development Co
Create a Home Valuation Report for This Property
The Home Valuation Report is an in-depth analysis detailing your home's value as well as a comparison with similar homes in the area
Home Values in the Area
Average Home Value in this Area
Purchase History
| Date | Buyer | Sale Price | Title Company |
|---|---|---|---|
| Russell John Samuel | -- | -- | |
| Russell John Samuel | $262,000 | Attorney | |
| Egersdorfer Melissa A | $299,000 | Attorney | |
| Mckinley Development Co | -- | -- |
Source: Public Records
Mortgage History
| Date | Status | Borrower | Loan Amount |
|---|---|---|---|
| Previous Owner | Egersdorfer Melissa A | $254,150 |
Source: Public Records
Tax History Compared to Growth
Tax History
| Year | Tax Paid | Tax Assessment Tax Assessment Total Assessment is a certain percentage of the fair market value that is determined by local assessors to be the total taxable value of land and additions on the property. | Land | Improvement |
|---|---|---|---|---|
| 2025 | $4,666 | $149,210 | $38,120 | $111,090 |
| 2024 | $3,014 | $149,210 | $38,120 | $111,090 |
| 2023 | $5,728 | $132,590 | $36,720 | $95,870 |
| 2022 | $5,478 | $132,590 | $36,720 | $95,870 |
| 2021 | $5,063 | $132,590 | $36,720 | $95,870 |
| 2020 | $4,885 | $113,370 | $31,920 | $81,450 |
| 2019 | $4,832 | $113,370 | $31,920 | $81,450 |
| 2018 | $4,757 | $113,370 | $31,920 | $81,450 |
| 2017 | $9,987 | $101,080 | $28,000 | $73,080 |
| 2016 | $4,605 | $101,080 | $28,000 | $73,080 |
| 2015 | $4,763 | $101,080 | $28,000 | $73,080 |
| 2014 | $257 | $88,200 | $24,430 | $63,770 |
| 2013 | $2,133 | $88,200 | $24,430 | $63,770 |
Source: Public Records
Map
Nearby Homes
- 0 Marquardt Dr NW
- 1010 Las Olas Blvd NW
- 119 Stone Crossing St NE
- 1200 Briarview Ave NW
- 0 Marquardt Ave
- 1141 Las Olas Blvd NW
- 2211 Markley St NW
- 1240 7th St NE
- 1216 Marquardt Ave NW
- 1904 Red Coach Rd NW
- 1240 Fountain View St NE
- 221 Briar Ave NE
- 1404 Southbrook Cir NE
- 1020 Pickforde Dr NE
- 6816 Harrington Court Ave NE
- 7455 Brushmore Ave NW
- 1402 Schneider St NW
- 6650 Harvest Ridge Ave NE
- Cumberland Plan at Fountains at Edgewood
- Roanoke Plan at Fountains at Edgewood
- 1801 Swanhurst Cir NE
- 1810 Cheswold Cir NE
- 1815 Swanhurst Cir NE
- 1800 Cheswold Cir NE
- 1808 Swanhurst Cir NE
- 1829 Swanhurst Cir NE
- 1820 Cheswold Cir NE
- 1816 Swanhurst Cir NE
- 1805 Cheswold Cir NE
- 1824 Swanhurst Cir NE
- 1832 Wendover Cir NE
- 1824 Wendover Cir NE
- 1815 Cheswold Cir NE
- 1840 Wendover Cir NE
- 1834 Swanhurst Cir NE
- 1814 Wendover Cir NE
- 1825 Cheswold Cir NE
- 1804 Wendover Cir NE
- 1804 Cheswold Cir NE
- 1842 Swanhurst Cir NE