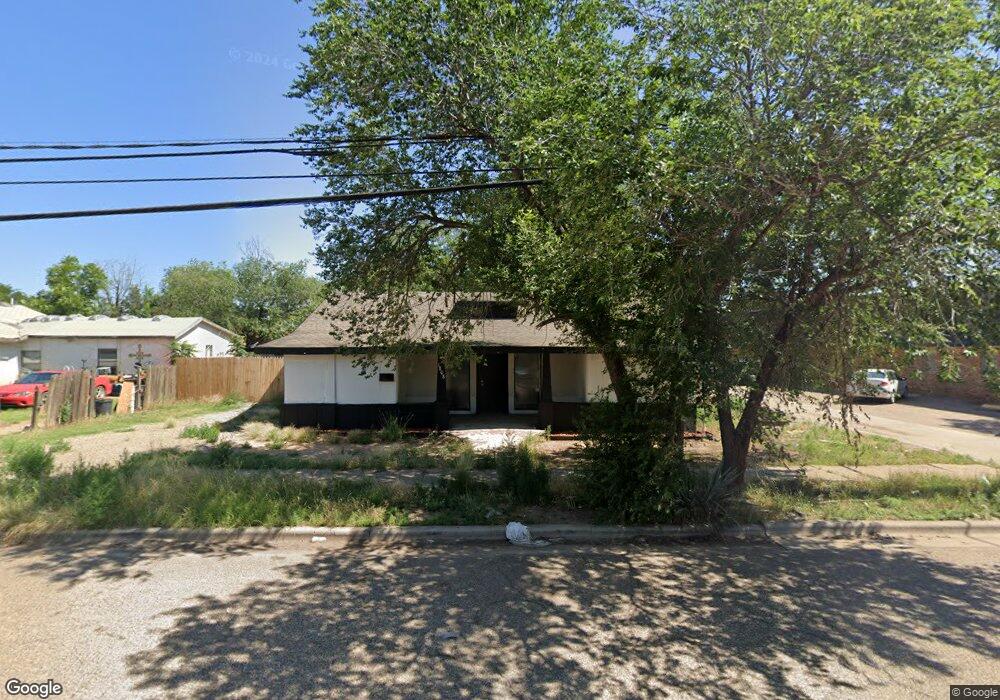
1808 18th St Unit E Lubbock, TX 79401
South Overton NeighborhoodEstimated Value: $87,000 - $201,586
1
Bed
1
Bath
600
Sq Ft
$216/Sq Ft
Est. Value
About This Home
This home is located at 1808 18th St Unit E, Lubbock, TX 79401 and is currently estimated at $129,647, approximately $216 per square foot. 1808 18th St Unit E is a home located in Lubbock County with nearby schools including Ramirez Elementary School, Hutchinson Middle School, and Lubbock High School.
Ownership History
Date
Name
Owned For
Owner Type
Purchase Details
Closed on
Nov 25, 2019
Sold by
Mitley Llc
Bought by
Thunder Sun Inc
Current Estimated Value
Home Financials for this Owner
Home Financials are based on the most recent Mortgage that was taken out on this home.
Original Mortgage
$114,800
Interest Rate
3.6%
Mortgage Type
Commercial
Purchase Details
Closed on
Apr 16, 2004
Sold by
Fuller Shawn
Bought by
Howard Philip
Purchase Details
Closed on
Mar 10, 1995
Sold by
Martin Keith and Martin Theresa
Bought by
Howard Philip
Create a Home Valuation Report for This Property
The Home Valuation Report is an in-depth analysis detailing your home's value as well as a comparison with similar homes in the area
Home Values in the Area
Average Home Value in this Area
Purchase History
| Date | Buyer | Sale Price | Title Company |
|---|---|---|---|
| Thunder Sun Inc | -- | Service Title | |
| Howard Philip | -- | -- | |
| Howard Philip | -- | -- | |
| Howard Philip | -- | -- |
Source: Public Records
Mortgage History
| Date | Status | Borrower | Loan Amount |
|---|---|---|---|
| Closed | Thunder Sun Inc | $114,800 |
Source: Public Records
Tax History
| Year | Tax Paid | Tax Assessment Tax Assessment Total Assessment is a certain percentage of the fair market value that is determined by local assessors to be the total taxable value of land and additions on the property. | Land | Improvement |
|---|---|---|---|---|
| 2025 | $1,082 | $59,599 | $22,600 | $36,999 |
| 2024 | $11 | $59,599 | $22,600 | $36,999 |
| 2023 | $1,616 | $86,916 | $8,561 | $78,355 |
| 2022 | $1,650 | $81,485 | $8,561 | $72,924 |
| 2021 | $2,932 | $136,920 | $8,561 | $128,359 |
| 2020 | $2,602 | $119,640 | $8,561 | $111,079 |
| 2019 | $2,686 | $119,640 | $8,561 | $111,079 |
| 2018 | $2,689 | $119,640 | $8,561 | $111,079 |
| 2017 | $2,693 | $119,640 | $8,561 | $111,079 |
| 2016 | $2,415 | $107,298 | $8,561 | $98,737 |
| 2015 | $2,388 | $107,763 | $8,561 | $99,202 |
| 2014 | $2,388 | $107,375 | $2,952 | $104,423 |
Source: Public Records
Map
Nearby Homes
- 1812 18th St
- 1807 18th St
- 1807 17th St
- 1809 18th St
- 1811 18th St
- 1902 18th St
- 1803 18th St
- 1904 18th St
- 1901 17th St
- 1801 18th St
- 1805 Avenue S
- 1806 Avenue R
- 1807 Avenue S
- 1906 18th St
- 1712 18th St Unit D
- 1712 18th St Unit A
- 1712 18th St
- 1810 Avenue R Unit C
- 1810 Avenue R Unit Rear
- 1810 Avenue R Unit A
Your Personal Tour Guide
Ask me questions while you tour the home.