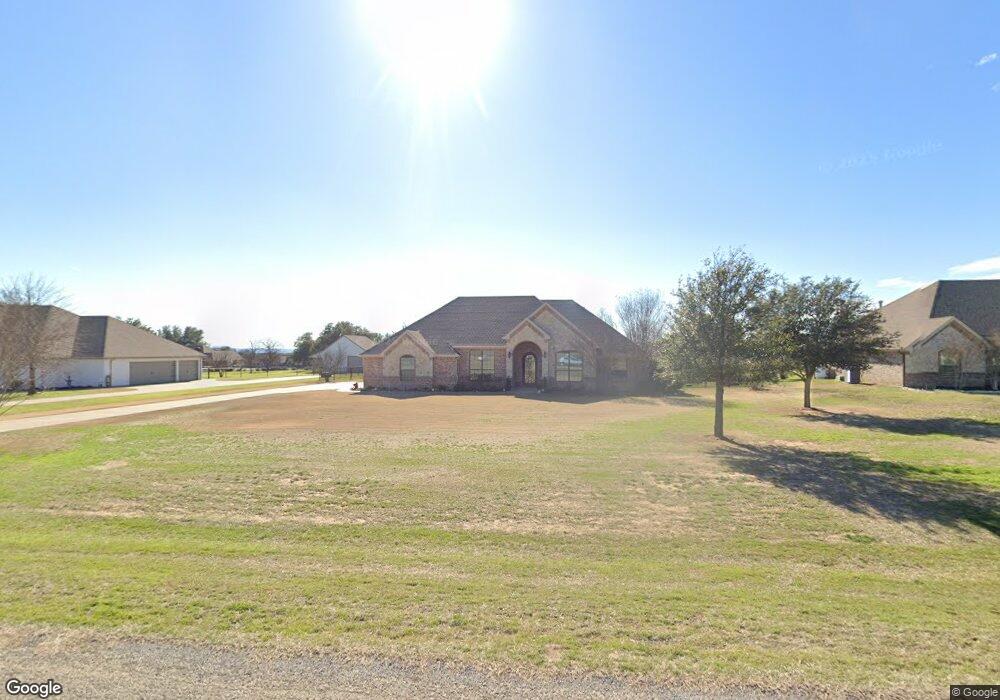
1808 Bentwater Pkwy Granbury, TX 76049
Estimated Value: $525,879 - $577,000
3
Beds
3
Baths
2,300
Sq Ft
$243/Sq Ft
Est. Value
About This Home
This home is located at 1808 Bentwater Pkwy, Granbury, TX 76049 and is currently estimated at $558,220, approximately $242 per square foot. 1808 Bentwater Pkwy is a home located in Hood County with nearby schools including Oak Woods School, Acton Middle School, and Granbury High School.
Ownership History
Date
Name
Owned For
Owner Type
Purchase Details
Closed on
Jul 2, 2010
Sold by
Petrozza Joseph and Cornerstone Homes
Bought by
Borre Richard
Current Estimated Value
Home Financials for this Owner
Home Financials are based on the most recent Mortgage that was taken out on this home.
Original Mortgage
$140,000
Outstanding Balance
$92,903
Interest Rate
4.77%
Mortgage Type
New Conventional
Estimated Equity
$465,317
Purchase Details
Closed on
Apr 20, 2005
Sold by
Hamilton Charles R and Hamilton Karen S
Bought by
Petrozza Joseph and Cornerstone Homes
Purchase Details
Closed on
Mar 9, 2000
Sold by
Properties Of The Southwest In
Bought by
Borre Richard
Purchase Details
Closed on
Jul 8, 1998
Bought by
Borre Richard
Create a Home Valuation Report for This Property
The Home Valuation Report is an in-depth analysis detailing your home's value as well as a comparison with similar homes in the area
Home Values in the Area
Average Home Value in this Area
Purchase History
| Date | Buyer | Sale Price | Title Company |
|---|---|---|---|
| Borre Richard | -- | Ctt | |
| Petrozza Joseph | -- | None Available | |
| Borre Richard | -- | -- | |
| Borre Richard | -- | -- |
Source: Public Records
Mortgage History
| Date | Status | Borrower | Loan Amount |
|---|---|---|---|
| Open | Borre Richard | $140,000 |
Source: Public Records
Tax History Compared to Growth
Tax History
| Year | Tax Paid | Tax Assessment Tax Assessment Total Assessment is a certain percentage of the fair market value that is determined by local assessors to be the total taxable value of land and additions on the property. | Land | Improvement |
|---|---|---|---|---|
| 2025 | $2,434 | $532,710 | $125,000 | $407,710 |
| 2024 | $2,545 | $491,960 | $125,000 | $366,960 |
| 2023 | $5,479 | $544,640 | $105,000 | $439,640 |
| 2022 | $4,404 | $461,910 | $60,000 | $401,910 |
| 2021 | $5,713 | $372,130 | $60,000 | $312,130 |
| 2020 | $5,355 | $350,990 | $50,000 | $300,990 |
| 2019 | $5,096 | $330,580 | $50,000 | $280,580 |
| 2018 | $4,632 | $284,940 | $50,000 | $234,940 |
| 2017 | $4,756 | $284,410 | $40,000 | $244,410 |
| 2016 | $4,453 | $266,310 | $40,000 | $226,310 |
| 2015 | $3,937 | $243,440 | $40,000 | $203,440 |
| 2014 | $3,937 | $249,150 | $35,000 | $214,150 |
Source: Public Records
Map
Nearby Homes
- 1716 Bent Tree Ct
- 2214 Tree Top Ct
- 2208 Beau West Ct
- 1302 E Baja Ct
- 1511 Lady Amber Ln
- 1208 E Baja Ct
- 1206 E Baja Ct
- 1407 Lady Amber Ln
- 2804 Alta Vista Ct
- 2201 Tanton Sound Ct
- 821 Williamson Rd
- 1204 E Scandinavian Ct
- 2103 Cash Point Ct
- 1400 Bentwater Pkwy
- 2116 Darby Dan Ct
- 614 Pluto St
- 2113 Darby Dan Ct
- 2901 Space Ct
- 2508 Wills Way Dr
- 2701 Wills Way Dr
- 1810 Bentwater Pkwy
- 1806 Bentwater Pkwy
- 1812 Bentwater Pkwy
- 1804 Bentwater Pkwy
- 1814 Bentwater Pkwy
- 1721 Bent Tree Ct
- 1725 Bent Tree Ct
- 1807 Bentwater Pkwy
- 1816 Bentwater Pkwy
- 1800 Bentwater Pkwy
- 1811 Bentwater Pkwy
- 1727 Bent Tree Ct
- 2300 Chad Ln
- 1801 Bentwater Pkwy
- 1717 Bent Tree Ct
- 1712 Bentwater Pkwy
- 1720 Bent Tree Ct
- 1729 Bent Tree Ct
- 1817 Bentwater Pkwy
- 1726 Bent Tree Ct