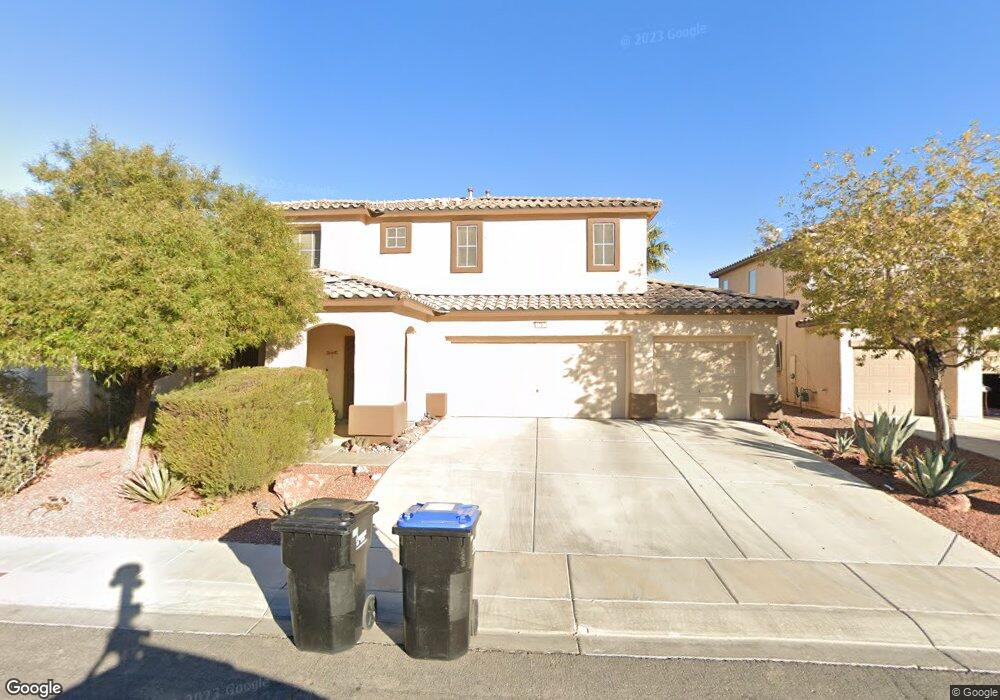
1808 Dragonfly Ranch Ln Unit 2 North Las Vegas, NV 89081
Northridge NeighborhoodEstimated Value: $502,000 - $550,000
3
Beds
3
Baths
2,777
Sq Ft
$190/Sq Ft
Est. Value
About This Home
This home is located at 1808 Dragonfly Ranch Ln Unit 2, North Las Vegas, NV 89081 and is currently estimated at $527,189, approximately $189 per square foot. 1808 Dragonfly Ranch Ln Unit 2 is a home located in Clark County with nearby schools including Don E. Hayden Elementary School, Ruby Duncan Elementary School, and Carroll M. Johnston STEM Academy of Environmental Studies.
Ownership History
Date
Name
Owned For
Owner Type
Purchase Details
Closed on
Nov 22, 2017
Sold by
Campbell James A and Campbell Beverly K
Bought by
Campbell James Angell and Campbell Beverly Kay
Current Estimated Value
Purchase Details
Closed on
Jul 19, 2011
Sold by
Fannie Mae
Bought by
Campbell James A and Campbell Beverly K
Home Financials for this Owner
Home Financials are based on the most recent Mortgage that was taken out on this home.
Original Mortgage
$140,000
Outstanding Balance
$96,043
Interest Rate
4.45%
Mortgage Type
New Conventional
Estimated Equity
$431,146
Purchase Details
Closed on
Apr 12, 2011
Sold by
Cottrill Travis and Cottrill Paula
Bought by
Fannie Mae and Federal National Mortgage Association
Purchase Details
Closed on
Sep 23, 2004
Sold by
William Lyon Homes Inc
Bought by
Cottrill Travis and Cottrill Paula
Home Financials for this Owner
Home Financials are based on the most recent Mortgage that was taken out on this home.
Original Mortgage
$260,550
Interest Rate
5.8%
Mortgage Type
Unknown
Create a Home Valuation Report for This Property
The Home Valuation Report is an in-depth analysis detailing your home's value as well as a comparison with similar homes in the area
Home Values in the Area
Average Home Value in this Area
Purchase History
| Date | Buyer | Sale Price | Title Company |
|---|---|---|---|
| Campbell James Angell | -- | None Available | |
| Campbell James A | $175,000 | Old Republic Title Company | |
| Fannie Mae | $285,032 | Old Republic | |
| Cottrill Travis | $325,738 | Fidelity National Title |
Source: Public Records
Mortgage History
| Date | Status | Borrower | Loan Amount |
|---|---|---|---|
| Open | Campbell James A | $140,000 | |
| Previous Owner | Cottrill Travis | $260,550 | |
| Closed | Cottrill Travis | $48,450 |
Source: Public Records
Tax History Compared to Growth
Tax History
| Year | Tax Paid | Tax Assessment Tax Assessment Total Assessment is a certain percentage of the fair market value that is determined by local assessors to be the total taxable value of land and additions on the property. | Land | Improvement |
|---|---|---|---|---|
| 2025 | $2,408 | $163,644 | $35,700 | $127,944 |
| 2024 | $2,339 | $163,644 | $35,700 | $127,944 |
| 2023 | $2,339 | $151,869 | $31,850 | $120,019 |
| 2022 | $2,271 | $138,192 | $28,350 | $109,842 |
| 2021 | $2,205 | $128,463 | $24,500 | $103,963 |
| 2020 | $2,137 | $119,022 | $25,550 | $93,472 |
| 2019 | $2,075 | $113,101 | $22,050 | $91,051 |
| 2018 | $2,015 | $100,797 | $17,500 | $83,297 |
| 2017 | $3,034 | $90,460 | $16,800 | $73,660 |
| 2016 | $1,908 | $78,753 | $13,650 | $65,103 |
| 2015 | $1,904 | $66,877 | $9,450 | $57,427 |
| 2014 | $1,848 | $53,466 | $7,350 | $46,116 |
Source: Public Records
Map
Nearby Homes
- 6216 Sterling Ranch Way
- 1505 Dragonfly Ranch Ln
- 5925 Teeter St
- 2330 Tate Ave
- 2326 Tate Ave
- 6016 Star Point Ct
- 1409 Palomino Farm Way
- 6242 Standing Elm St
- Eden Plan at Grandview
- Alma Plan at Grandview
- Caden Plan at Grandview
- 6005 Golden Sun Ct
- 6424 Amanda Michelle Ln
- 6105 Musas Garden St Unit 246
- 6164 Musas Garden St Unit 203
- 1023 Sunny Acres Ave
- 6083 Cosmos Garden St
- 6116 Musas Garden St
- 6108 Musas Garden St
- 1504 Andrew David Ave
- 1812 Dragonfly Ranch Ln
- 1804 Dragonfly Ranch Ln
- 1712 Dragonfly Ranch Ln
- 1816 Dragonfly Ranch Ln
- 1809 Dragonfly Ranch Ln
- 1805 Dragonfly Ranch Ln
- 1813 Dragonfly Ranch Ln
- 1708 Dragonfly Ranch Ln
- 1809 Lazy Hill Ranch Way Unit x
- 1713 Dragonfly Ranch Ln Unit 2
- 6204 Sterling Ranch Way
- 1805 Lazy Hill Ranch Way
- 6144 Stanton Summit Dr
- 1713 Lazy Hill Ranch Way Unit 1
- 1709 Dragonfly Ranch Ln
- 6140 Stanton Summit Dr Unit 2
- 1704 Dragonfly Ranch Ln Unit 2
- 1808 Big Valley Ln
- 6208 Sterling Ranch Way
- 1804 Big Valley Ln Unit 2