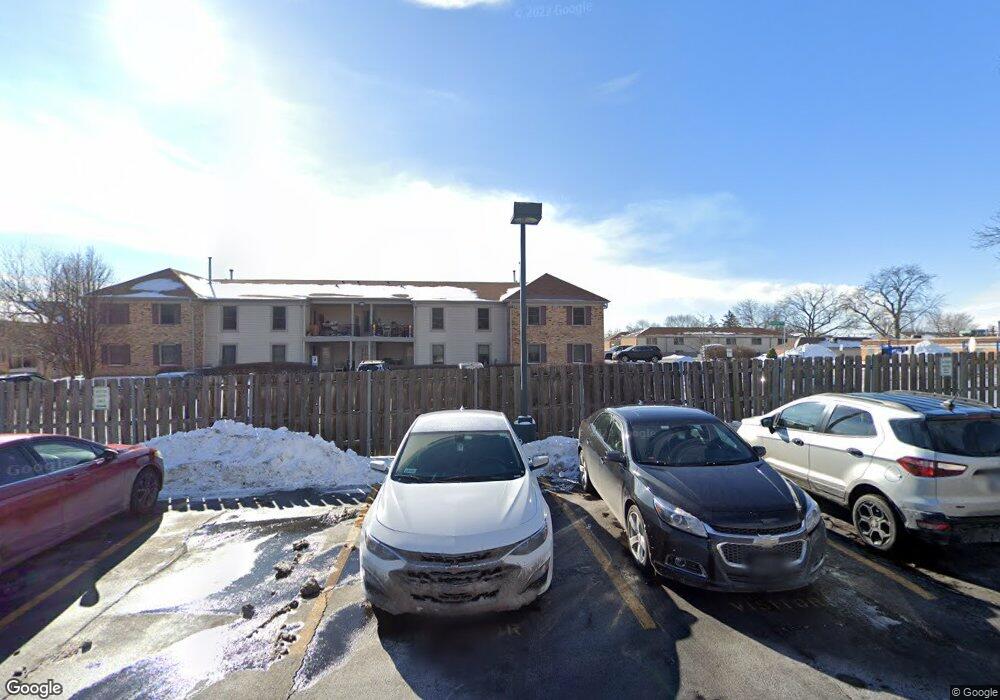
1808 Fayette Walk Unit 1808G Hoffman Estates, IL 60169
South Hoffman Estates NeighborhoodEstimated Value: $193,000 - $222,000
2
Beds
1
Bath
1,100
Sq Ft
$187/Sq Ft
Est. Value
About This Home
This home is located at 1808 Fayette Walk Unit 1808G, Hoffman Estates, IL 60169 and is currently estimated at $205,394, approximately $186 per square foot. 1808 Fayette Walk Unit 1808G is a home located in Cook County with nearby schools including John Muir Literacy Academy, Dwight D Eisenhower Junior High School, and Hoffman Estates High School.
Ownership History
Date
Name
Owned For
Owner Type
Purchase Details
Closed on
Jan 24, 2005
Sold by
Jackson Chase Peggy Ann and Chase Jimmy
Bought by
Foley Brendan J and Foley Kristen A
Current Estimated Value
Home Financials for this Owner
Home Financials are based on the most recent Mortgage that was taken out on this home.
Original Mortgage
$118,037
Outstanding Balance
$60,154
Interest Rate
5.79%
Mortgage Type
Unknown
Estimated Equity
$145,240
Purchase Details
Closed on
May 5, 2000
Sold by
Lasalle Bank Na
Bought by
Jackson Chase Peggy Ann
Home Financials for this Owner
Home Financials are based on the most recent Mortgage that was taken out on this home.
Original Mortgage
$73,000
Interest Rate
8.26%
Purchase Details
Closed on
Dec 9, 1993
Sold by
Christopher David A and Christopher Antoinette C
Bought by
Reyes Maria A
Home Financials for this Owner
Home Financials are based on the most recent Mortgage that was taken out on this home.
Original Mortgage
$54,000
Interest Rate
7.15%
Create a Home Valuation Report for This Property
The Home Valuation Report is an in-depth analysis detailing your home's value as well as a comparison with similar homes in the area
Home Values in the Area
Average Home Value in this Area
Purchase History
| Date | Buyer | Sale Price | Title Company |
|---|---|---|---|
| Foley Brendan J | $124,500 | First American Title Ins Co | |
| Jackson Chase Peggy Ann | -- | -- | |
| Reyes Maria A | $45,000 | -- |
Source: Public Records
Mortgage History
| Date | Status | Borrower | Loan Amount |
|---|---|---|---|
| Open | Foley Brendan J | $118,037 | |
| Previous Owner | Jackson Chase Peggy Ann | $73,000 | |
| Previous Owner | Reyes Maria A | $54,000 |
Source: Public Records
Tax History Compared to Growth
Tax History
| Year | Tax Paid | Tax Assessment Tax Assessment Total Assessment is a certain percentage of the fair market value that is determined by local assessors to be the total taxable value of land and additions on the property. | Land | Improvement |
|---|---|---|---|---|
| 2024 | $3,095 | $13,403 | $2,799 | $10,604 |
| 2023 | $2,964 | $13,403 | $2,799 | $10,604 |
| 2022 | $2,964 | $13,403 | $2,799 | $10,604 |
| 2021 | $2,414 | $10,536 | $4,407 | $6,129 |
| 2020 | $2,432 | $10,536 | $4,407 | $6,129 |
| 2019 | $2,441 | $11,766 | $4,407 | $7,359 |
| 2018 | $1,346 | $7,562 | $3,848 | $3,714 |
| 2017 | $1,341 | $7,562 | $3,848 | $3,714 |
| 2016 | $1,509 | $7,562 | $3,848 | $3,714 |
| 2015 | $761 | $4,994 | $3,358 | $1,636 |
| 2014 | $765 | $4,994 | $3,358 | $1,636 |
| 2013 | $727 | $4,994 | $3,358 | $1,636 |
Source: Public Records
Map
Nearby Homes
- 1800 Fayette Walk Unit E
- 1808 Fayette Walk Unit H
- 1840 Huntington Blvd Unit BW608
- 1800 Huntington Blvd Unit AE212
- 1712 Fayette Walk Unit D
- 1860 Huntington Blvd Unit E
- 1612 Islandview Ct
- 1850 Jamestown Cir Unit 392
- 1700 Robin Ln Unit 1D
- 2021 Kensington Ln Unit 3004
- 2027 Kensington Ln Unit 3001
- 2025 Kensington Ln Unit 3002
- 2001 Kensington Ln Unit 1005
- 2023 Kensington Ln Unit 3003
- 2003 Kensington Ln Unit 1004
- 1908 Kenilworth Cir Unit H
- 1375 Rebecca Dr Unit 213
- 1930 Kenilworth Cir Unit E
- 1975 Kenilworth Cir Unit B
- 1874 Wellington Place
- 1808 Fayette Walk Unit 1808D
- 1808 Fayette Walk Unit 1808C
- 1808 Fayette Walk Unit 1808H
- 1808 Fayette Walk Unit C
- 1800 Fayette Walk Unit 1800E
- 1800 Fayette Walk Unit 1800F
- 1800 Fayette Walk Unit 1800A
- 1800 Fayette Walk Unit 1800B
- 1800 Fayette Walk Unit B
- 1796 Fayette Walk Unit 1796F
- 1804 Fayette Walk Unit 1804D
- 1796 Fayette Walk Unit 1796A
- 1804 Fayette Walk Unit 1804C
- 1796 Fayette Walk Unit 1796B
- 1804 Fayette Walk Unit 1804G
- 1796 Fayette Walk Unit 1796E
- 1804 Fayette Walk Unit 1804H
- 1796 Fayette Walk Unit B
- 1804 Fayette Walk Unit H
- 1796 Fayette Walk Unit F