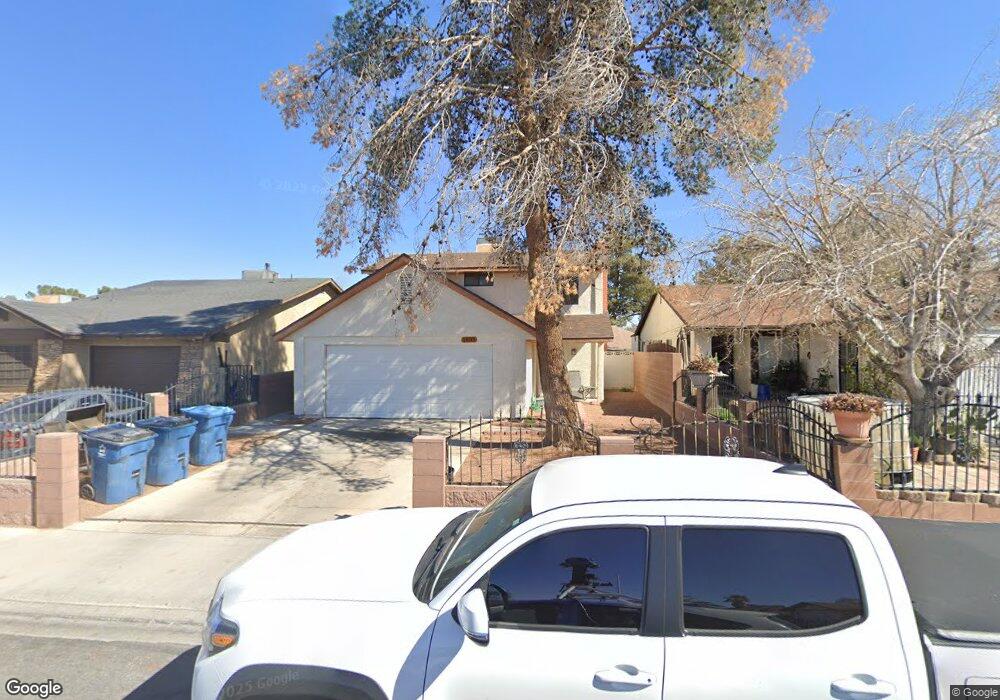
1808 Marathon Dr Las Vegas, NV 89108
Michael Way NeighborhoodEstimated Value: $219,835 - $247,000
2
Beds
2
Baths
900
Sq Ft
$260/Sq Ft
Est. Value
About This Home
This home is located at 1808 Marathon Dr, Las Vegas, NV 89108 and is currently estimated at $234,209, approximately $260 per square foot. 1808 Marathon Dr is a home located in Clark County with nearby schools including Lilly & Wing Fong Elementary School, J. Harold Brinley Middle School, and Western High School.
Ownership History
Date
Name
Owned For
Owner Type
Purchase Details
Closed on
Aug 11, 2009
Sold by
Us Bank National Association
Bought by
Olson Gary Douglas and Olson Robert Bruce
Current Estimated Value
Purchase Details
Closed on
May 15, 2009
Sold by
Mudge Gary and Mudge Laura
Bought by
Us Bank National Association and Sasco 2007-Wf1
Purchase Details
Closed on
Aug 16, 2007
Sold by
Mudge Gary John and Mudge Laura Lynn
Bought by
Mudge Gary John and Mudge Laura Lynn
Purchase Details
Closed on
Jan 25, 2006
Sold by
Chipman Lacinda J
Bought by
Mudge Gary and Mudge Laura
Home Financials for this Owner
Home Financials are based on the most recent Mortgage that was taken out on this home.
Original Mortgage
$110,500
Interest Rate
9.4%
Mortgage Type
Fannie Mae Freddie Mac
Purchase Details
Closed on
Oct 6, 2004
Sold by
French Charles W and French Myrtle P
Bought by
Chipman Lacinda J
Home Financials for this Owner
Home Financials are based on the most recent Mortgage that was taken out on this home.
Original Mortgage
$52,200
Interest Rate
5.77%
Mortgage Type
New Conventional
Create a Home Valuation Report for This Property
The Home Valuation Report is an in-depth analysis detailing your home's value as well as a comparison with similar homes in the area
Home Values in the Area
Average Home Value in this Area
Purchase History
| Date | Buyer | Sale Price | Title Company |
|---|---|---|---|
| Olson Gary Douglas | $49,900 | Chicago Title | |
| Us Bank National Association | $52,000 | Servicelink | |
| Mudge Gary John | -- | None Available | |
| Mudge Gary | $111,000 | First Amer Title Co Of Nv | |
| Chipman Lacinda J | $58,000 | Ticor Title Of Nevada Inc |
Source: Public Records
Mortgage History
| Date | Status | Borrower | Loan Amount |
|---|---|---|---|
| Previous Owner | Mudge Gary | $110,500 | |
| Previous Owner | Chipman Lacinda J | $52,200 |
Source: Public Records
Tax History Compared to Growth
Tax History
| Year | Tax Paid | Tax Assessment Tax Assessment Total Assessment is a certain percentage of the fair market value that is determined by local assessors to be the total taxable value of land and additions on the property. | Land | Improvement |
|---|---|---|---|---|
| 2025 | $601 | $35,862 | $15,050 | $20,812 |
| 2024 | $584 | $35,862 | $15,050 | $20,812 |
| 2023 | $584 | $37,346 | $17,850 | $19,496 |
| 2022 | $567 | $34,496 | $15,750 | $18,746 |
| 2021 | $551 | $27,951 | $12,250 | $15,701 |
| 2020 | $532 | $27,731 | $11,200 | $16,531 |
| 2019 | $516 | $25,702 | $9,100 | $16,602 |
| 2018 | $501 | $24,770 | $8,750 | $16,020 |
| 2017 | $769 | $23,105 | $7,350 | $15,755 |
| 2016 | $476 | $20,543 | $4,200 | $16,343 |
| 2015 | $474 | $16,940 | $3,500 | $13,440 |
| 2014 | $460 | $13,995 | $3,010 | $10,985 |
Source: Public Records
Map
Nearby Homes
- 1814 Marathon Dr
- 1801 Marathon Dr
- 1713 Amboy Dr
- 1704 Kismet Cir
- 6633 Gazelle Dr
- 1701 Goodrich Cir
- 1630 Harvest Pecan Ct
- 6520 Lombard Dr
- 1516 Bonnie Castle Way
- 6637 Lund Dr
- 1816 N Torrey Pines Dr
- 6400 Starcrest Dr
- 1436 Padre Bay Dr
- 1624 N Torrey Pines Dr Unit 104
- 1608 N Torrey Pines Dr Unit 103
- 1624 N Torrey Pines Dr Unit 101
- 1600 N Torrey Pines Dr Unit 202
- 1600 N Torrey Pines Dr Unit 101
- 1900 N Torrey Pines Dr Unit 212
- 1900 N Torrey Pines Dr Unit 223
- 1806 Marathon Dr
- 1810 Marathon Dr
- 1809 Amboy Dr
- 1801 Amboy Dr
- 1812 Marathon Dr
- 1804 Marathon Dr Unit 42
- 1813 Amboy Dr
- 1741 Amboy Dr
- 1805 Marathon Dr Unit 38
- 1807 Marathon Dr
- 1809 Marathon Dr
- 1803 Marathon Dr
- 1803 Marathon Dr
- 1737 Amboy Dr
- 1821 Amboy Dr
- 1811 Marathon Dr
- 1800 Marathon Dr
- 1808 Discus Dr
- 1802 Discus Dr Unit 32
- 1733 Amboy Dr