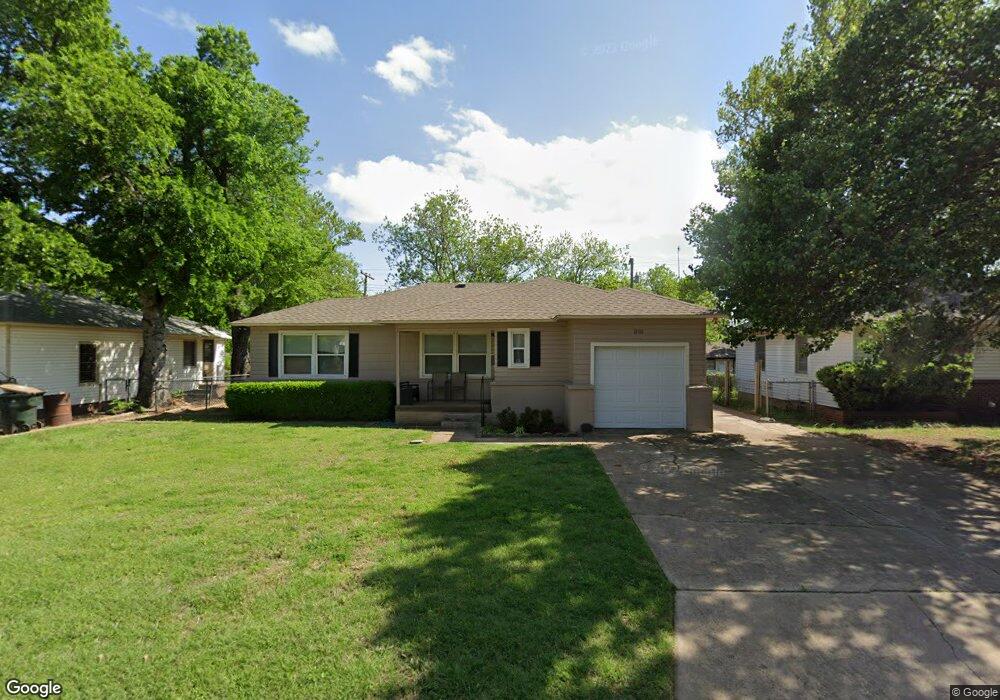
1808 W Birch Ave Duncan, OK 73533
Estimated Value: $64,674 - $90,000
3
Beds
2
Baths
951
Sq Ft
$79/Sq Ft
Est. Value
About This Home
This home is located at 1808 W Birch Ave, Duncan, OK 73533 and is currently estimated at $75,419, approximately $79 per square foot. 1808 W Birch Ave is a home located in Stephens County with nearby schools including Mark Twain Elementary School, Duncan Middle School, and Duncan High School.
Ownership History
Date
Name
Owned For
Owner Type
Purchase Details
Closed on
Aug 10, 2007
Sold by
Timmins Dustin J
Bought by
Newton Velva R
Current Estimated Value
Home Financials for this Owner
Home Financials are based on the most recent Mortgage that was taken out on this home.
Original Mortgage
$48,000
Outstanding Balance
$30,298
Interest Rate
6.69%
Mortgage Type
New Conventional
Estimated Equity
$45,121
Purchase Details
Closed on
Jun 1, 2006
Sold by
Eades Bryan M and Eades Jennifer Ann
Bought by
Timmins Dustin J
Home Financials for this Owner
Home Financials are based on the most recent Mortgage that was taken out on this home.
Original Mortgage
$37,149
Interest Rate
6.5%
Mortgage Type
Purchase Money Mortgage
Purchase Details
Closed on
Jun 29, 2000
Sold by
Edmonson Timothy and Edmonson Heila
Purchase Details
Closed on
May 28, 1999
Sold by
Hurst Sheila
Purchase Details
Closed on
Jun 13, 1996
Sold by
Hurst Michael
Purchase Details
Closed on
Aug 16, 1991
Sold by
Hurst Sheila
Create a Home Valuation Report for This Property
The Home Valuation Report is an in-depth analysis detailing your home's value as well as a comparison with similar homes in the area
Home Values in the Area
Average Home Value in this Area
Purchase History
| Date | Buyer | Sale Price | Title Company |
|---|---|---|---|
| Newton Velva R | $48,000 | Stewart Abstract & Title | |
| Timmins Dustin J | $36,500 | None Available | |
| -- | $34,000 | -- | |
| -- | -- | -- | |
| -- | -- | -- | |
| -- | -- | -- |
Source: Public Records
Mortgage History
| Date | Status | Borrower | Loan Amount |
|---|---|---|---|
| Open | Newton Velva R | $48,000 | |
| Previous Owner | Timmins Dustin J | $37,149 |
Source: Public Records
Tax History Compared to Growth
Tax History
| Year | Tax Paid | Tax Assessment Tax Assessment Total Assessment is a certain percentage of the fair market value that is determined by local assessors to be the total taxable value of land and additions on the property. | Land | Improvement |
|---|---|---|---|---|
| 2025 | $188 | $3,207 | $273 | $2,934 |
| 2024 | $188 | $3,207 | $319 | $2,888 |
| 2023 | $188 | $3,207 | $361 | $2,846 |
| 2022 | $188 | $3,207 | $404 | $2,803 |
| 2021 | $188 | $3,208 | $440 | $2,768 |
| 2020 | $191 | $3,207 | $534 | $2,673 |
| 2019 | $191 | $3,208 | $506 | $2,702 |
| 2018 | $197 | $3,207 | $471 | $2,736 |
| 2017 | $190 | $3,207 | $568 | $2,639 |
| 2016 | $335 | $4,945 | $526 | $4,419 |
| 2015 | $338 | $4,946 | $555 | $4,391 |
| 2014 | $338 | $4,802 | $550 | $4,252 |
Source: Public Records
Map
Nearby Homes
- 174831 N 2844 Rd
- 1812 W Walnut Ave
- 2006 W Oak Ave
- 2011 2011 W Oak Ave
- 2108 Ave
- 2110 W Main St
- 210 N 22nd St
- 209 N 22nd St
- 201 N 23rd St
- 27 N 14th St
- 106 Emery Rd
- 1203 W Walnut Ave
- 2210 Western Dr
- 1309 W Pecan Ave
- 507 N Alice Dr
- 206 N 28th St
- 1116 1116 W Chestnut
- 1105 W Beech Ave
- 273787 E 1720 Rd
- 1213 W Pine Ave
- 1810 W Birch Ave
- 1806 W Birch Ave
- 1810 W Birch Ave
- 1807 W Walnut Ave
- 1807 1807 W Walnut
- 1807 W Walnut Ave
- 1809 W Walnut Ave
- 1812 W Birch Ave
- 1804 W Birch Ave
- 1805 W Walnut Ave
- 1812 W Birch Ave
- 1807 W Birch Ave
- 1809 W Birch Ave
- 1805 W Birch Ave
- 1805 1805 Birch
- 1811 W Walnut Ave
- 1803 W Walnut Ave
- 1817 W Walnut Ave
- 1802 W Birch Ave
- 1811 W Birch Ave