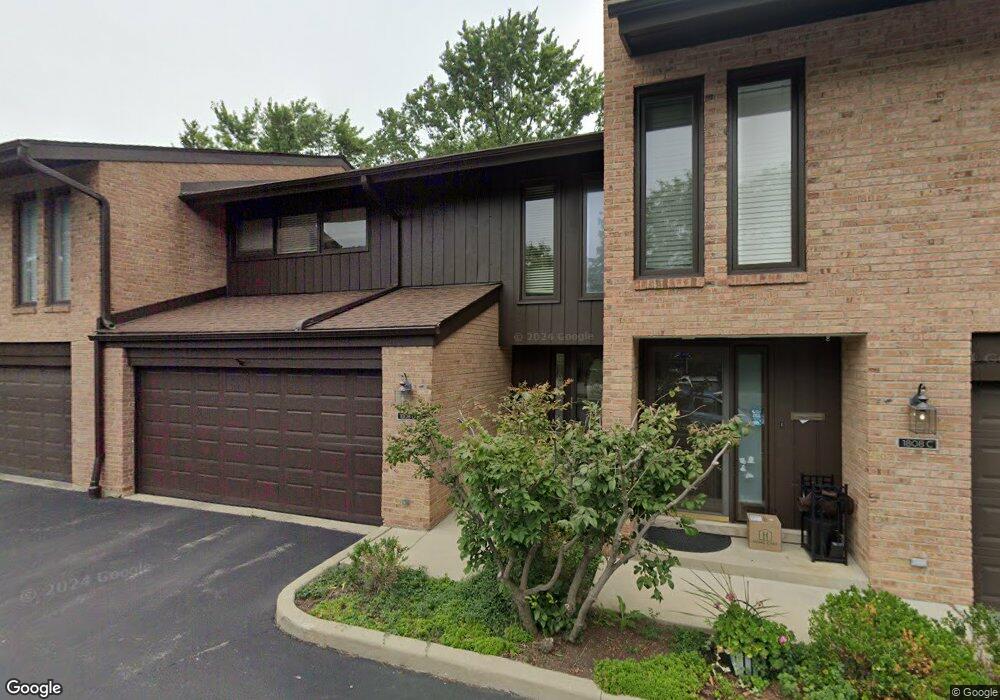
1808 Wildberry Dr Unit 10A Glenview, IL 60025
Estimated Value: $403,333 - $490,000
2
Beds
1
Bath
13,148
Sq Ft
$35/Sq Ft
Est. Value
About This Home
This home is located at 1808 Wildberry Dr Unit 10A, Glenview, IL 60025 and is currently estimated at $454,833, approximately $34 per square foot. 1808 Wildberry Dr Unit 10A is a home located in Cook County with nearby schools including Lyon Elementary School, Pleasant Ridge Elementary School, and Attea Middle School.
Ownership History
Date
Name
Owned For
Owner Type
Purchase Details
Closed on
Oct 22, 2020
Sold by
Harkness Toni M and The Toni M Harkness Declaratio
Bought by
Cho Hyun Young and Kim Young Soon
Current Estimated Value
Home Financials for this Owner
Home Financials are based on the most recent Mortgage that was taken out on this home.
Original Mortgage
$261,000
Interest Rate
2.87%
Mortgage Type
New Conventional
Purchase Details
Closed on
Aug 19, 2014
Sold by
Harkness Toni M
Bought by
Harkness Toni M and Toni M Harkness Declaration Of Trust
Purchase Details
Closed on
May 30, 2006
Sold by
Harvey Marie T
Bought by
Harkness Toni
Purchase Details
Closed on
Jul 31, 1996
Sold by
Bolan Michael B and Bolan Andria B
Bought by
Harvey Marie T
Home Financials for this Owner
Home Financials are based on the most recent Mortgage that was taken out on this home.
Original Mortgage
$152,000
Interest Rate
8%
Create a Home Valuation Report for This Property
The Home Valuation Report is an in-depth analysis detailing your home's value as well as a comparison with similar homes in the area
Home Values in the Area
Average Home Value in this Area
Purchase History
| Date | Buyer | Sale Price | Title Company |
|---|---|---|---|
| Cho Hyun Young | $290,000 | Proper Title Llc | |
| Harkness Toni M | -- | None Available | |
| Harkness Toni | $315,000 | Fort Dearborn Land Title | |
| Harvey Marie T | $190,000 | -- |
Source: Public Records
Mortgage History
| Date | Status | Borrower | Loan Amount |
|---|---|---|---|
| Previous Owner | Cho Hyun Young | $261,000 | |
| Previous Owner | Harvey Marie T | $152,000 |
Source: Public Records
Tax History Compared to Growth
Tax History
| Year | Tax Paid | Tax Assessment Tax Assessment Total Assessment is a certain percentage of the fair market value that is determined by local assessors to be the total taxable value of land and additions on the property. | Land | Improvement |
|---|---|---|---|---|
| 2024 | $5,383 | $30,289 | $3,997 | $26,292 |
| 2023 | $5,190 | $30,289 | $3,997 | $26,292 |
| 2022 | $5,190 | $30,289 | $3,997 | $26,292 |
| 2021 | $5,518 | $28,163 | $4,096 | $24,067 |
| 2020 | $5,553 | $28,163 | $4,096 | $24,067 |
| 2019 | $5,186 | $31,038 | $4,096 | $26,942 |
| 2018 | $4,211 | $24,494 | $3,597 | $20,897 |
| 2017 | $4,123 | $24,494 | $3,597 | $20,897 |
| 2016 | $4,276 | $24,494 | $3,597 | $20,897 |
| 2015 | $4,605 | $23,833 | $3,097 | $20,736 |
| 2014 | $4,542 | $23,833 | $3,097 | $20,736 |
| 2013 | $4,380 | $23,833 | $3,097 | $20,736 |
Source: Public Records
Map
Nearby Homes
- 1833 Wildberry Dr Unit E
- 804 8th St
- 1300 W Branch Rd
- 2101 Valley lo Ln
- 2430 Dorina Dr
- 2640 Summit Dr Unit 110
- 1955 Tanglewood Dr Unit H
- 2700 Summit Dr Unit 101
- 2700 Summit Dr Unit 409
- 1774 Rogers Ave
- 2688 Summit Dr
- 1410 Tuscany Ct
- 1743 Melise Dr
- 1908 Monroe Ave Unit 7
- 1855 Tanglewood Dr Unit F
- 1763 Jefferson Ave Unit 1
- 2301 Clover Ln
- 1815 Tanglewood Dr Unit 4D
- 1804 Monroe Ct Unit 101804
- 1471 Ammer Rd
- 1808 Wildberry Dr Unit D
- 1808 Wildberry Dr Unit 10B
- 1808 Wildberry Dr Unit 10F
- 1808 Wildberry Dr Unit 10D
- 1808 Wildberry Dr Unit 10E
- 1808 Wildberry Dr Unit 10C
- 1808 Wildberry Dr Unit A
- 1808 Wildberry Dr Unit C
- 1808 Wildberry Dr Unit B
- 1808 Wildberry Dr Unit F
- 59 S Branch Rd
- 1804 Wildberry Dr Unit B
- 1804 Wildberry Dr Unit 11B
- 1804 Wildberry Dr Unit 11A
- 1804 Wildberry Dr Unit 11D
- 1804 Wildberry Dr Unit 11C
- 1804 Wildberry Dr Unit D
- 45 S Branch Rd
- 45 S Branch Rd
- 1812 Wildberry Dr Unit 9D