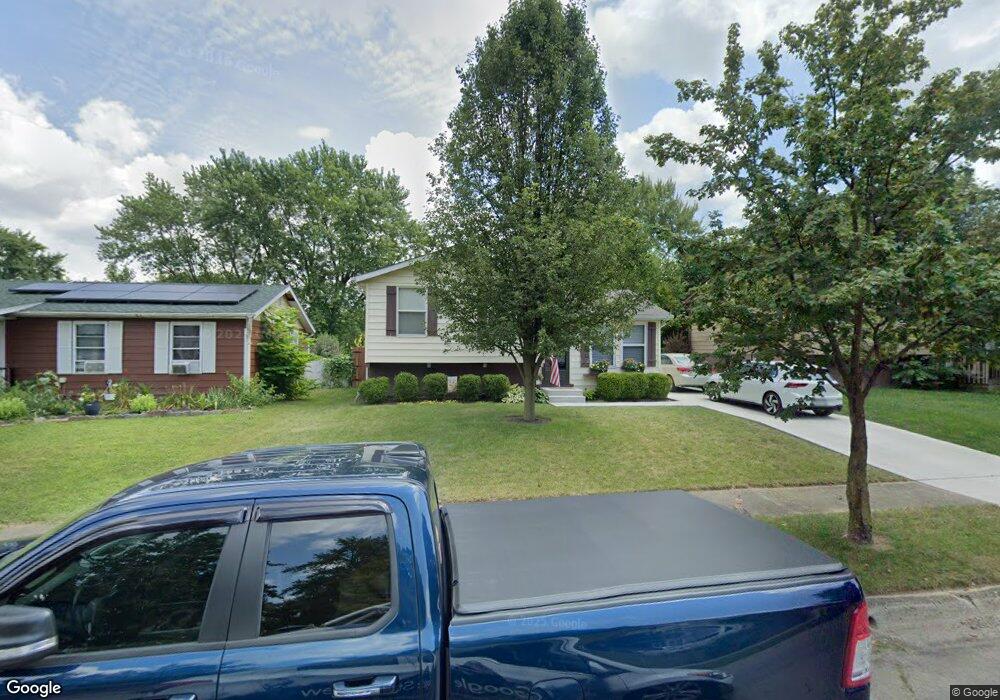
1808 Winding Field St Columbus, OH 43223
Riverbend NeighborhoodEstimated Value: $194,000 - $219,000
3
Beds
1
Bath
1,068
Sq Ft
$192/Sq Ft
Est. Value
About This Home
This home is located at 1808 Winding Field St, Columbus, OH 43223 and is currently estimated at $205,264, approximately $192 per square foot. 1808 Winding Field St is a home located in Franklin County with nearby schools including James A Harmon Elementary School, Franklin Woods Intermediate School, and Finland Middle School.
Ownership History
Date
Name
Owned For
Owner Type
Purchase Details
Closed on
Aug 15, 2000
Sold by
Cochran Chad E
Bought by
Dial Darrell and Dial Ann
Current Estimated Value
Home Financials for this Owner
Home Financials are based on the most recent Mortgage that was taken out on this home.
Original Mortgage
$85,586
Interest Rate
8.12%
Mortgage Type
FHA
Purchase Details
Closed on
Jan 22, 1999
Sold by
Wallace Miranda J
Bought by
Cochran Chad E
Purchase Details
Closed on
Nov 2, 1995
Sold by
Teresa L Kirk and Teresa Woods
Bought by
Chad E Cochran and Wallace Miranda J
Home Financials for this Owner
Home Financials are based on the most recent Mortgage that was taken out on this home.
Original Mortgage
$67,433
Interest Rate
7.61%
Mortgage Type
FHA
Purchase Details
Closed on
Sep 20, 1990
Purchase Details
Closed on
Dec 1, 1983
Create a Home Valuation Report for This Property
The Home Valuation Report is an in-depth analysis detailing your home's value as well as a comparison with similar homes in the area
Home Values in the Area
Average Home Value in this Area
Purchase History
| Date | Buyer | Sale Price | Title Company |
|---|---|---|---|
| Dial Darrell | $85,700 | Secured Title Solutions Inc | |
| Cochran Chad E | -- | -- | |
| Chad E Cochran | $68,700 | -- | |
| -- | -- | -- | |
| -- | $39,900 | -- |
Source: Public Records
Mortgage History
| Date | Status | Borrower | Loan Amount |
|---|---|---|---|
| Closed | Dial Darrell | $85,586 | |
| Previous Owner | Chad E Cochran | $67,433 |
Source: Public Records
Tax History Compared to Growth
Tax History
| Year | Tax Paid | Tax Assessment Tax Assessment Total Assessment is a certain percentage of the fair market value that is determined by local assessors to be the total taxable value of land and additions on the property. | Land | Improvement |
|---|---|---|---|---|
| 2024 | $1,968 | $53,970 | $16,730 | $37,240 |
| 2023 | $1,933 | $53,970 | $16,730 | $37,240 |
| 2022 | $1,537 | $31,500 | $8,750 | $22,750 |
| 2021 | $1,568 | $31,500 | $8,750 | $22,750 |
| 2020 | $1,559 | $31,500 | $8,750 | $22,750 |
| 2019 | $1,463 | $26,080 | $7,280 | $18,800 |
| 2018 | $1,448 | $26,080 | $7,280 | $18,800 |
| 2017 | $1,445 | $26,080 | $7,280 | $18,800 |
| 2016 | $1,440 | $23,800 | $4,830 | $18,970 |
| 2015 | $1,440 | $23,800 | $4,830 | $18,970 |
| 2014 | $1,441 | $23,800 | $4,830 | $18,970 |
| 2013 | $794 | $26,425 | $5,355 | $21,070 |
Source: Public Records
Map
Nearby Homes
- 1830 Winding Hollow Dr
- 3206 Andy Terrace
- 2062 Summer Banks Dr
- 1657 Ripplebrook Rd
- 1485 Demorest Rd
- 2930 Alkire Rd
- 3326 Bluhm Ct
- 3488 Rocky Rd
- 3623 High Creek Dr
- 2188 Dry Ridge Ct
- 2155 Pentress Dr
- 3728 Miltonsburg Dr
- 3766 Dunlane Ct
- 3728 Greenock Ct
- 1465 Tall Meadows Dr
- 2800 Alkire Rd
- 2157 Hierarch Ct
- 1226 Pinnacle Dr
- 1520 Fall Brook Rd
- 1181 Onslow Dr
- 1850 Winding Field St
- 1858 Winding Field St
- 1866 Winding Field St
- 1800 Winding Field St
- 1816 Winding Field St
- 1874 Winding Field St
- 1882 Winding Field St
- 1794 Winding Field St
- 1824 Winding Field St
- 1813 Hollow Run Dr
- 1819 Hollow Run Dr
- 1805 Hollow Run Dr
- 1851 Winding Field St
- 1859 Winding Field St
- 1867 Winding Field St
- 1883 Winding Field St
- 1875 Winding Field St
- 1891 Winding Field St
- 1825 Hollow Run Dr
- 1830 Winding Field St