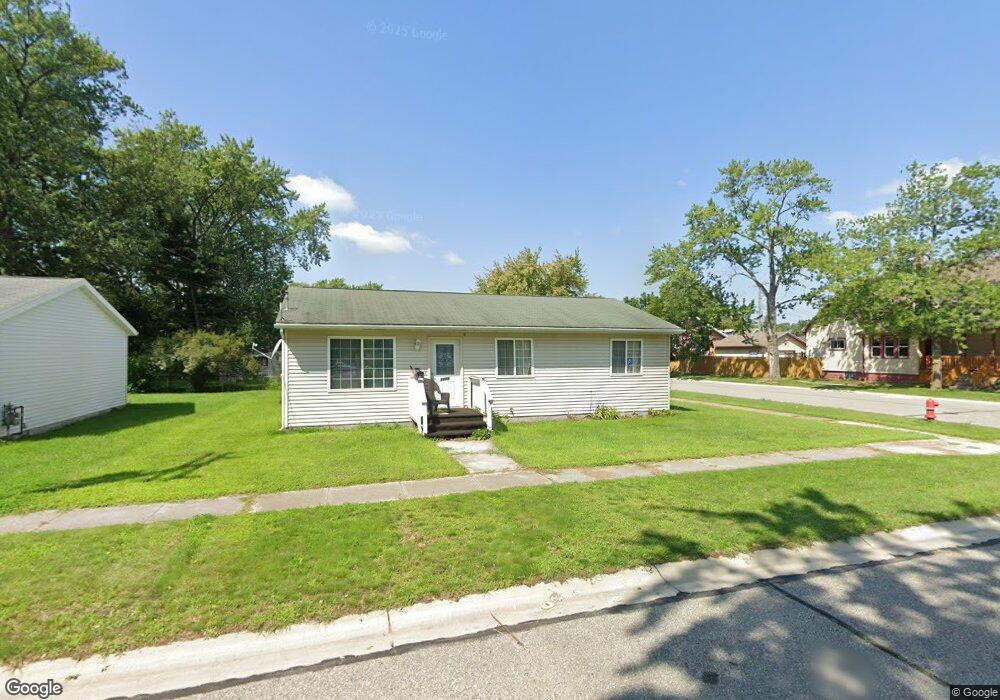
1809 17th St Port Huron, MI 48060
Estimated Value: $137,000 - $150,620
3
Beds
2
Baths
1,040
Sq Ft
$138/Sq Ft
Est. Value
About This Home
This home is located at 1809 17th St, Port Huron, MI 48060 and is currently estimated at $143,905, approximately $138 per square foot. 1809 17th St is a home located in St. Clair County with nearby schools including Michigamme Elementary School, Central Middle School, and Port Huron High School.
Ownership History
Date
Name
Owned For
Owner Type
Purchase Details
Closed on
May 20, 2010
Sold by
Block Charles R and Block Amy E
Bought by
Federal Home Loan Mortgage Corp
Current Estimated Value
Purchase Details
Closed on
Oct 30, 2006
Sold by
Wells Fargo Bank Na
Bought by
Block Charles R and Block Amy E
Home Financials for this Owner
Home Financials are based on the most recent Mortgage that was taken out on this home.
Original Mortgage
$80,000
Interest Rate
6.45%
Mortgage Type
Purchase Money Mortgage
Purchase Details
Closed on
Jan 10, 2006
Sold by
Mortgage Electronic Registration System
Bought by
Wells Fargo Bank Na
Purchase Details
Closed on
Jan 6, 2006
Sold by
Brooks James
Bought by
Mortgage Electronic Registration Systems
Create a Home Valuation Report for This Property
The Home Valuation Report is an in-depth analysis detailing your home's value as well as a comparison with similar homes in the area
Home Values in the Area
Average Home Value in this Area
Purchase History
| Date | Buyer | Sale Price | Title Company |
|---|---|---|---|
| Federal Home Loan Mortgage Corp | $80,778 | None Available | |
| Block Charles R | $72,500 | First American Title Ins | |
| Wells Fargo Bank Na | -- | None Available | |
| Mortgage Electronic Registration Systems | $78,445 | None Available |
Source: Public Records
Mortgage History
| Date | Status | Borrower | Loan Amount |
|---|---|---|---|
| Previous Owner | Block Charles R | $80,000 |
Source: Public Records
Tax History Compared to Growth
Tax History
| Year | Tax Paid | Tax Assessment Tax Assessment Total Assessment is a certain percentage of the fair market value that is determined by local assessors to be the total taxable value of land and additions on the property. | Land | Improvement |
|---|---|---|---|---|
| 2025 | $1,613 | $67,400 | $0 | $0 |
| 2024 | $1,198 | $65,100 | $0 | $0 |
| 2023 | $1,132 | $58,900 | $0 | $0 |
| 2022 | $1,139 | $48,900 | $0 | $0 |
| 2021 | $1,082 | $41,700 | $0 | $0 |
| 2020 | $1,094 | $36,600 | $36,600 | $0 |
| 2019 | $1,074 | $23,500 | $0 | $0 |
| 2018 | $1,051 | $23,500 | $0 | $0 |
| 2017 | $939 | $22,200 | $0 | $0 |
| 2016 | $795 | $22,200 | $0 | $0 |
| 2015 | $817 | $22,100 | $22,100 | $0 |
| 2014 | $817 | $22,800 | $22,800 | $0 |
| 2013 | -- | $24,200 | $0 | $0 |
Source: Public Records
Map
Nearby Homes