
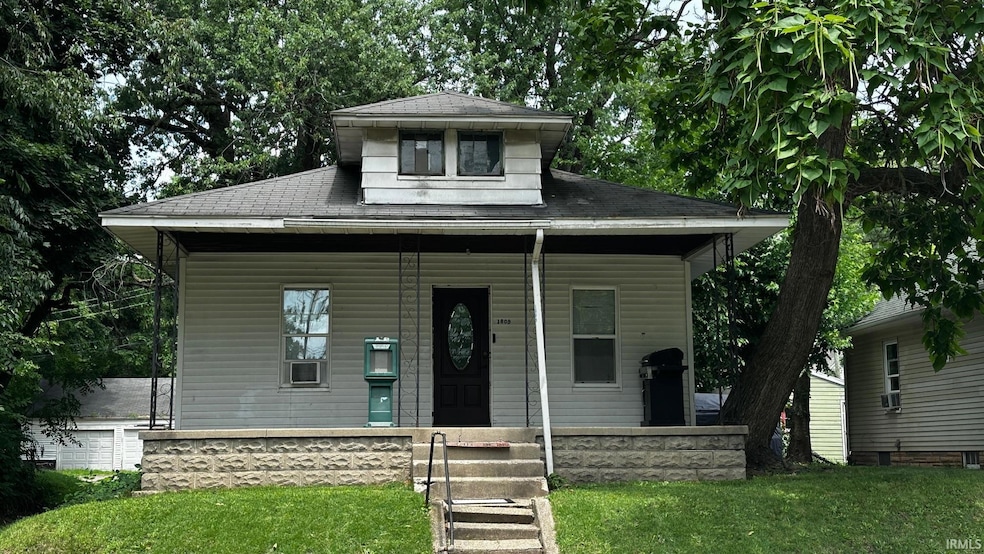
1809 Elwood Ave South Bend, IN 46628
Estimated payment $748/month
Total Views
20,155
2
Beds
1
Bath
1,296
Sq Ft
$93
Price per Sq Ft
Highlights
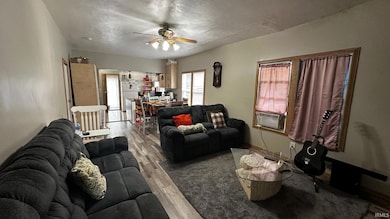
- Ceramic Tile Flooring
- Space Heater
- Wood Fence
- 1-Story Property
About This Home
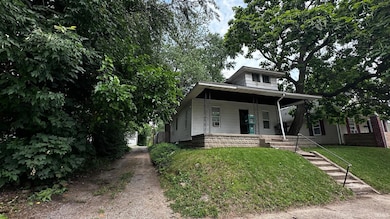
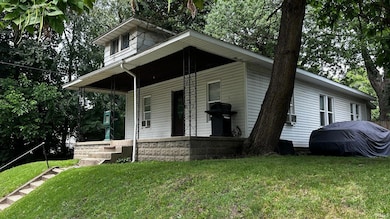
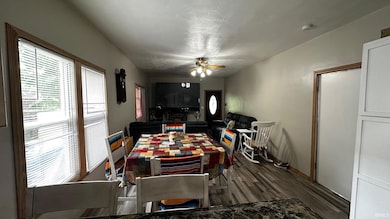
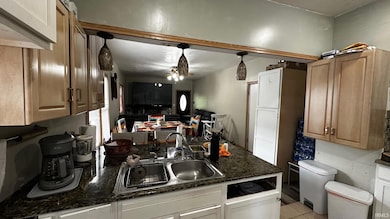
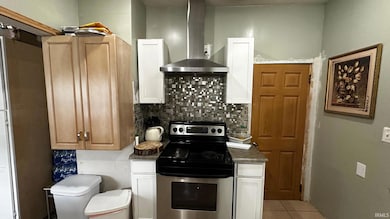
Excellent Opportunity in South Bend! A hidden gem with tons of potential, ready to shine with your custom finishing touches. This home offers two bedrooms and one bathroom on the main level, plus two additional rooms with closets and a family room in the basement, perfect for extra space or entertainment. Enjoy a fully fenced backyard with a wooden privacy fence, ideal for kids, pets, or outdoor gatherings. Located in the desirable LaSalle area, just steps from Portage Ave, close to schools, shops, and more. Don’t miss the chance to become a homeowner today!
Home Details
Home Type
- Single Family
Est. Annual Taxes
- $1,388
Year Built
- Built in 1924
Lot Details
- 5,888 Sq Ft Lot
- Lot Dimensions are 46x128
- Wood Fence
- Sloped Lot
Home Design
- Slab Foundation
- Shingle Roof
- Vinyl Construction Material
Interior Spaces
- 1-Story Property
- Partially Finished Basement
Flooring
- Carpet
- Laminate
- Ceramic Tile
Bedrooms and Bathrooms
- 2 Bedrooms
- 1 Full Bathroom
Location
- Suburban Location
Schools
- Muessel Elementary School
- Dickinson Middle School
- Clay High School
Utilities
- Window Unit Cooling System
- Space Heater
Listing and Financial Details
- Assessor Parcel Number 71-03-34-481-026.000-026
Map
Create a Home Valuation Report for This Property
The Home Valuation Report is an in-depth analysis detailing your home's value as well as a comparison with similar homes in the area
Home Values in the Area
Average Home Value in this Area
Tax History
| Year | Tax Paid | Tax Assessment Tax Assessment Total Assessment is a certain percentage of the fair market value that is determined by local assessors to be the total taxable value of land and additions on the property. | Land | Improvement |
|---|---|---|---|---|
| 2024 | $1,316 | $53,400 | $6,900 | $46,500 |
| 2023 | $751 | $53,400 | $6,900 | $46,500 |
| 2022 | $751 | $31,300 | $6,900 | $24,400 |
| 2021 | $643 | $23,200 | $900 | $22,300 |
| 2020 | $600 | $23,200 | $900 | $22,300 |
| 2019 | $609 | $23,200 | $900 | $22,300 |
| 2018 | $656 | $23,200 | $900 | $22,300 |
| 2017 | $614 | $23,000 | $900 | $22,100 |
| 2016 | $627 | $23,000 | $900 | $22,100 |
| 2014 | $591 | $22,600 | $900 | $21,700 |
Source: Public Records
Property History
| Date | Event | Price | List to Sale | Price per Sq Ft |
|---|---|---|---|---|
| 07/23/2025 07/23/25 | For Sale | $119,900 | -- | $93 / Sq Ft |
Source: Indiana Regional MLS
Purchase History
| Date | Type | Sale Price | Title Company |
|---|---|---|---|
| Quit Claim Deed | -- | None Available | |
| Quit Claim Deed | -- | None Available | |
| Quit Claim Deed | -- | None Listed On Document | |
| Warranty Deed | -- | -- | |
| Warranty Deed | -- | -- | |
| Quit Claim Deed | -- | None Available | |
| Warranty Deed | -- | None Available | |
| Warranty Deed | -- | Title Works |
Source: Public Records
Mortgage History
| Date | Status | Loan Amount | Loan Type |
|---|---|---|---|
| Previous Owner | $32,400 | Adjustable Rate Mortgage/ARM |
Source: Public Records
About the Listing Agent
Carlos' Other Listings
Source: Indiana Regional MLS
MLS Number: 202528910
APN: 71-03-34-481-026.000-026
Disclaimer: Certain information contained herein is derived from information provided by parties other than Homes.com. All information provided is deemed reliable, but is not guaranteed to be accurate and should be independently verified.
![]() IDX information is provided exclusively for personal, non-commercial use, and may not be used for any purpose other than to identify prospective properties consumers may be interested in purchasing. Information is deemed reliable but not guaranteed.
IDX information is provided exclusively for personal, non-commercial use, and may not be used for any purpose other than to identify prospective properties consumers may be interested in purchasing. Information is deemed reliable but not guaranteed.
Nearby Homes
- 1421 N Brookfield St
- 1501 N Adams St
- 1337 N Adams St
- 1618 Elwood Ave
- 1427 N Johnson St
- 1305 N Johnson St
- 1419 Johnson St
- 1602 College St
- 1404 Wilber St
- 1338 Obrien St
- 1514 Obrien St
- 1614 O Brien St
- 1645 N Adams St
- 1210 Johnson St
- 1649 N Adams St
- 1618 Wilber St
- 1146 College St
- 738 Huey St
- 1521 Huey St
- 1138 College St
- 1710 Elwood Ave
- 1346 N Johnson St
- 1229 N Johnson St
- 1646 N Brookfield St
- 1622 Wilber St
- 1142 N Elmer St
- 1325 N Meade St
- 2616 Elwood Ave
- 1234 Portage Ave
- 1132 Portage Ave Unit NotreDame BeaconRiverwalk
- 1128 Portage Ave Unit Sharehome 1 bdrm/priv 1ba
- 743 Diamond Ave
- 1643 Riverside Dr
- 2910 Frederickson St
- 2914 Frederickson St
- 317 Studebaker St
- 2527 Riverside Dr
- 617 Portage Ave
- 318 W Marion St Unit 1st Floor
- 429 W Lasalle Ave Unit 1