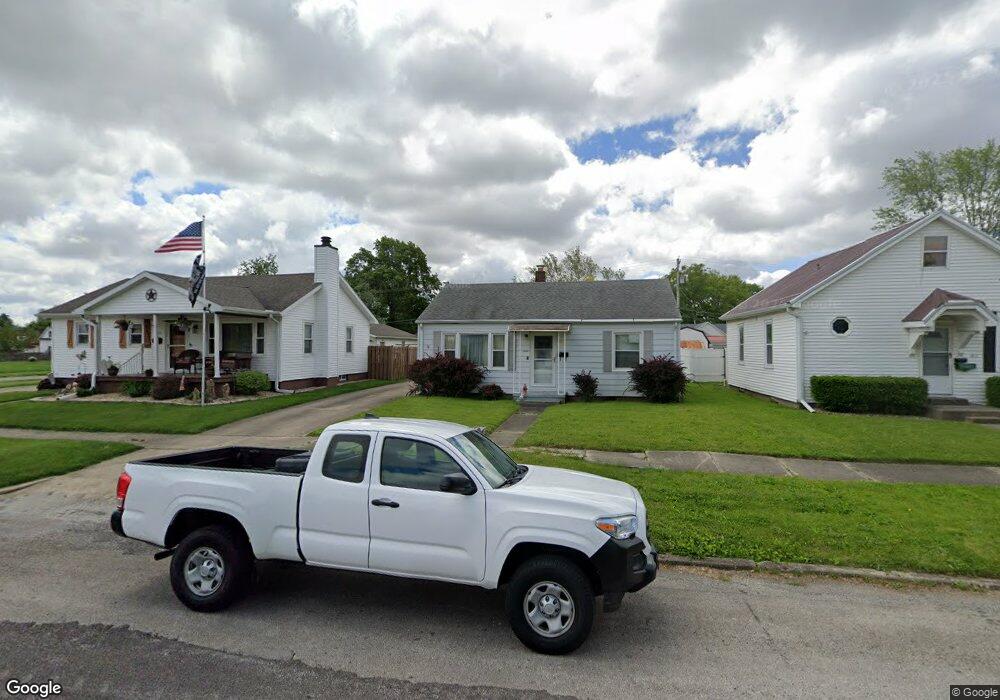
1809 Grant Ave Mattoon, IL 61938
Estimated Value: $101,123 - $126,000
3
Beds
1
Bath
1,104
Sq Ft
$100/Sq Ft
Est. Value
About This Home
This home is located at 1809 Grant Ave, Mattoon, IL 61938 and is currently estimated at $110,781, approximately $100 per square foot. 1809 Grant Ave is a home located in Coles County with nearby schools including Mattoon High School, St Mary School, and St. John's Lutheran School.
Ownership History
Date
Name
Owned For
Owner Type
Purchase Details
Closed on
Oct 5, 2006
Sold by
First Mid Illinois Bank & Trust N A
Bought by
Koester Keith A and Koester Karen L
Current Estimated Value
Home Financials for this Owner
Home Financials are based on the most recent Mortgage that was taken out on this home.
Original Mortgage
$55,920
Outstanding Balance
$33,424
Interest Rate
6.49%
Mortgage Type
New Conventional
Estimated Equity
$77,357
Purchase Details
Closed on
Nov 16, 2005
Sold by
Ingram Victor and Estate Of Daniel L Ingram
Bought by
First Mid Illinois Bank & Trust N A and Trust 95075
Home Financials for this Owner
Home Financials are based on the most recent Mortgage that was taken out on this home.
Original Mortgage
$51,000
Interest Rate
6.17%
Mortgage Type
Future Advance Clause Open End Mortgage
Create a Home Valuation Report for This Property
The Home Valuation Report is an in-depth analysis detailing your home's value as well as a comparison with similar homes in the area
Home Values in the Area
Average Home Value in this Area
Purchase History
| Date | Buyer | Sale Price | Title Company |
|---|---|---|---|
| Koester Keith A | $70,000 | None Available | |
| First Mid Illinois Bank & Trust N A | $51,500 | None Available |
Source: Public Records
Mortgage History
| Date | Status | Borrower | Loan Amount |
|---|---|---|---|
| Open | Koester Keith A | $55,920 | |
| Previous Owner | First Mid Illinois Bank & Trust N A | $51,000 |
Source: Public Records
Tax History
| Year | Tax Paid | Tax Assessment Tax Assessment Total Assessment is a certain percentage of the fair market value that is determined by local assessors to be the total taxable value of land and additions on the property. | Land | Improvement |
|---|---|---|---|---|
| 2024 | $1,687 | $25,850 | $4,641 | $21,209 |
| 2023 | $1,460 | $23,081 | $4,144 | $18,937 |
| 2022 | $1,460 | $22,700 | $4,076 | $18,624 |
| 2021 | $1,443 | $20,851 | $3,744 | $17,107 |
| 2020 | $1,422 | $21,604 | $3,879 | $17,725 |
| 2019 | $1,381 | $20,851 | $3,744 | $17,107 |
| 2018 | $1,356 | $20,851 | $3,744 | $17,107 |
| 2017 | $1,352 | $20,851 | $3,744 | $17,107 |
| 2016 | $1,323 | $20,851 | $3,744 | $17,107 |
| 2015 | $1,307 | $20,851 | $3,744 | $17,107 |
| 2014 | $1,307 | $20,851 | $3,744 | $17,107 |
| 2013 | $1,307 | $20,851 | $3,744 | $17,107 |
Source: Public Records
Map
Nearby Homes
- 1800 Piatt Ave
- 1905 Dewitt Ave
- 1 Brown Ct
- 713 N 23rd St
- 1612 Richmond Ave
- 2305 Shelby Ave
- 1412 Champaign Ave
- 2317 Shelby Ave
- 2413 Moultrie Ave
- 2305 Richmond Ave
- 916 Piatt Ave
- 1401 N 10th St
- 2617 Richmond Ave
- 2800 Shelby Ave
- 2720 Champaign Ave
- 109 N 26th St
- 113 S 25th St
- 812 N 8th St Unit 64
- 812 N 8th St Unit 36
- 2502 Pine Ave
Your Personal Tour Guide
Ask me questions while you tour the home.