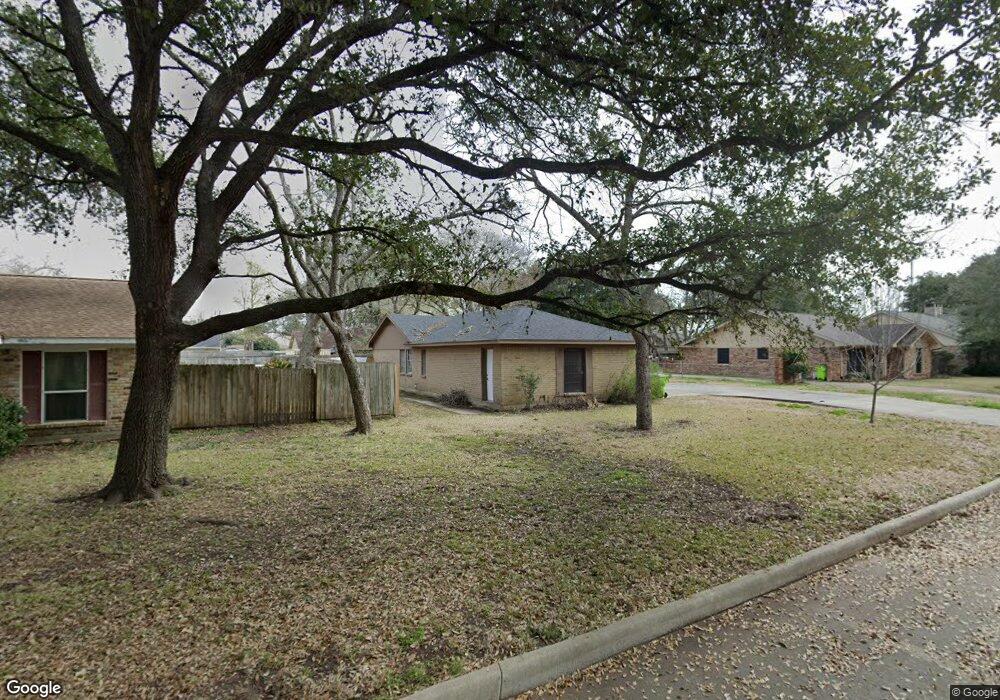
1809 Huisache Dr Richmond, TX 77469
Estimated Value: $217,000 - $262,000
3
Beds
2
Baths
1,718
Sq Ft
$136/Sq Ft
Est. Value
About This Home
This home is located at 1809 Huisache Dr, Richmond, TX 77469 and is currently estimated at $234,049, approximately $136 per square foot. 1809 Huisache Dr is a home located in Fort Bend County with nearby schools including Smith Elementary School, J J Wessendorff Middle School, and Lamar Junior High School.
Ownership History
Date
Name
Owned For
Owner Type
Purchase Details
Closed on
Oct 18, 2021
Sold by
Murphy Malavika K
Bought by
Resicap Texas Owner Llc
Current Estimated Value
Purchase Details
Closed on
Apr 14, 2014
Sold by
Vonvonmccarson Richard Von and Mccarson Richard V
Bought by
Murthy Malavika K
Purchase Details
Closed on
Aug 10, 2010
Sold by
Teel Billie Christine
Bought by
Vonmccarson Richard
Home Financials for this Owner
Home Financials are based on the most recent Mortgage that was taken out on this home.
Original Mortgage
$108,981
Interest Rate
4.69%
Mortgage Type
VA
Purchase Details
Closed on
Apr 8, 1998
Sold by
Teel William H and Teel William H
Bought by
Teel William H
Create a Home Valuation Report for This Property
The Home Valuation Report is an in-depth analysis detailing your home's value as well as a comparison with similar homes in the area
Home Values in the Area
Average Home Value in this Area
Purchase History
| Date | Buyer | Sale Price | Title Company |
|---|---|---|---|
| Resicap Texas Owner Llc | -- | North American Title | |
| Murthy Malavika K | -- | Old Republic National Title | |
| Vonmccarson Richard | -- | Stewart Title Richmond | |
| Teel William H | -- | -- |
Source: Public Records
Mortgage History
| Date | Status | Borrower | Loan Amount |
|---|---|---|---|
| Previous Owner | Vonmccarson Richard | $108,981 |
Source: Public Records
Tax History Compared to Growth
Tax History
| Year | Tax Paid | Tax Assessment Tax Assessment Total Assessment is a certain percentage of the fair market value that is determined by local assessors to be the total taxable value of land and additions on the property. | Land | Improvement |
|---|---|---|---|---|
| 2025 | $4,517 | $198,263 | $31,460 | $166,803 |
| 2024 | $4,517 | $204,490 | $31,460 | $173,030 |
| 2023 | $4,571 | $204,240 | $24,200 | $180,040 |
| 2022 | $4,317 | $183,450 | $24,200 | $159,250 |
| 2021 | $3,821 | $160,880 | $24,200 | $136,680 |
| 2020 | $3,916 | $162,500 | $22,000 | $140,500 |
| 2019 | $3,909 | $153,050 | $22,000 | $131,050 |
| 2018 | $3,542 | $137,860 | $22,000 | $115,860 |
| 2017 | $3,383 | $130,180 | $18,500 | $111,680 |
| 2016 | $3,156 | $121,430 | $18,500 | $102,930 |
| 2015 | $3,110 | $118,190 | $18,500 | $99,690 |
| 2014 | $1,884 | $112,000 | $18,500 | $93,500 |
Source: Public Records
Map
Nearby Homes
- 1805 Hawthorn Dr
- 1922 Teakwood St
- 1809 Hawthorn Dr
- 1806 Cedar Dr
- 1004 Country Club Dr
- 2015 Tanglelane St
- 0 Fm 2218 Unit 25550047
- 4502 River Rd
- 805 Chateau Place
- 0 Meadow Ln
- 1109 Frances Dr
- 2001 Briar Ln
- 000 Fm 2218 Rd
- 512 and 514 Travis St
- 400 Hillcrest Dr
- 6303 Buffalo Bend Ln
- 406 Fairway Dr
- 7315 Audubon Russet Dr
- 7322 Audubon Russet Dr
- 2143 Alabaster Estate Dr
- 1811 Huisache Dr
- 1805 Huisache Dr
- 1800 Laurel Oaks Dr
- 1710 Laurel Oaks Dr
- 1808 Laurel Oaks Dr
- 1808 Huisache Dr
- 1804 Laurel Oaks Dr
- 1803 Huisache Dr
- 1810 Huisache Dr
- 1708 Laurel Oaks Dr
- 1804 Huisache Dr
- 1801 Laurel Oaks Dr
- 1815 Laurel Oaks Dr
- 1820 Laurel Oaks Dr
- 1711 Laurel Oaks Dr
- 1803 Laurel Oaks Dr
- 1813 Laurel Oaks Dr
- 1817 Laurel Oaks Dr
- 1704 Laurel Oaks Dr
- 1507 Hawthorn Dr