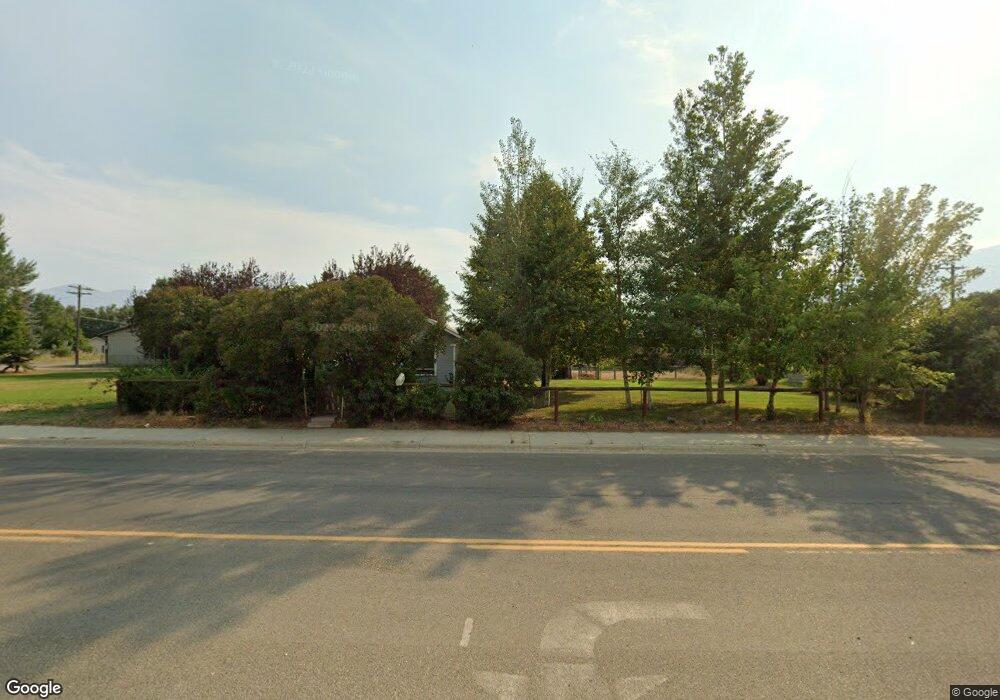
1809 Main St Salmon, ID 83467
Estimated Value: $194,000 - $250,000
2
Beds
1
Bath
924
Sq Ft
$241/Sq Ft
Est. Value
About This Home
This home is located at 1809 Main St, Salmon, ID 83467 and is currently estimated at $222,308, approximately $240 per square foot. 1809 Main St is a home located in Lemhi County with nearby schools including Salmon Pioneer Primary School, Salmon Jr./Sr. High School, and Fern-Waters Public Charter School.
Ownership History
Date
Name
Owned For
Owner Type
Purchase Details
Closed on
Apr 14, 2005
Sold by
Caywood Joyce
Bought by
Caywood Joseph R
Current Estimated Value
Home Financials for this Owner
Home Financials are based on the most recent Mortgage that was taken out on this home.
Original Mortgage
$61,100
Interest Rate
5.92%
Mortgage Type
New Conventional
Purchase Details
Closed on
Apr 11, 2005
Sold by
Best Linda K
Bought by
Caywood Joseph R
Home Financials for this Owner
Home Financials are based on the most recent Mortgage that was taken out on this home.
Original Mortgage
$61,100
Interest Rate
5.92%
Mortgage Type
New Conventional
Create a Home Valuation Report for This Property
The Home Valuation Report is an in-depth analysis detailing your home's value as well as a comparison with similar homes in the area
Home Values in the Area
Average Home Value in this Area
Purchase History
| Date | Buyer | Sale Price | Title Company |
|---|---|---|---|
| Caywood Joseph R | -- | None Available | |
| Caywood Joseph R | -- | None Available |
Source: Public Records
Mortgage History
| Date | Status | Borrower | Loan Amount |
|---|---|---|---|
| Closed | Caywood Joseph R | $61,100 | |
| Closed | Caywood Joseph R | $10,000 |
Source: Public Records
Tax History
| Year | Tax Paid | Tax Assessment Tax Assessment Total Assessment is a certain percentage of the fair market value that is determined by local assessors to be the total taxable value of land and additions on the property. | Land | Improvement |
|---|---|---|---|---|
| 2025 | $1,497 | $168,004 | $59,708 | $108,296 |
| 2024 | $1,513 | $168,004 | $59,708 | $108,296 |
| 2023 | $1,292 | $167,247 | $25,300 | $141,947 |
| 2022 | $1,309 | $167,247 | $25,300 | $141,947 |
| 2021 | $1,338 | $125,619 | $20,240 | $105,379 |
| 2020 | $842 | $72,352 | $14,674 | $57,678 |
| 2019 | $907 | $72,352 | $14,674 | $57,678 |
| 2018 | $911 | $71,126 | $24,288 | $46,838 |
| 2017 | $945 | $71,126 | $24,288 | $46,838 |
| 2016 | $1,000 | $71,126 | $24,288 | $46,838 |
| 2013 | $977 | $69,601 | $20,645 | $48,956 |
| 2011 | $977 | $73,155 | $17,204 | $55,951 |
Source: Public Records
Map
Nearby Homes
- 1509 Shoup St
- 901 Main St
- NKN U S 93
- TBD Jeffery Ln
- 407 Lena St
- NKN Cinnabar Cir
- 233 Obsidian Dr
- 406 S Terrace St
- 322 N Saint Charles St
- 109 Lena St
- 334 Catherine Ln
- TBD St Charles St
- 701 N St Charles St
- 2 Chaffin Ln
- 315 Riverfront Dr
- 5 Demick Ln
- 114 Neyman St
- 319 Snook St
- 409 Lombard St
- TBD Easy St
Your Personal Tour Guide
Ask me questions while you tour the home.