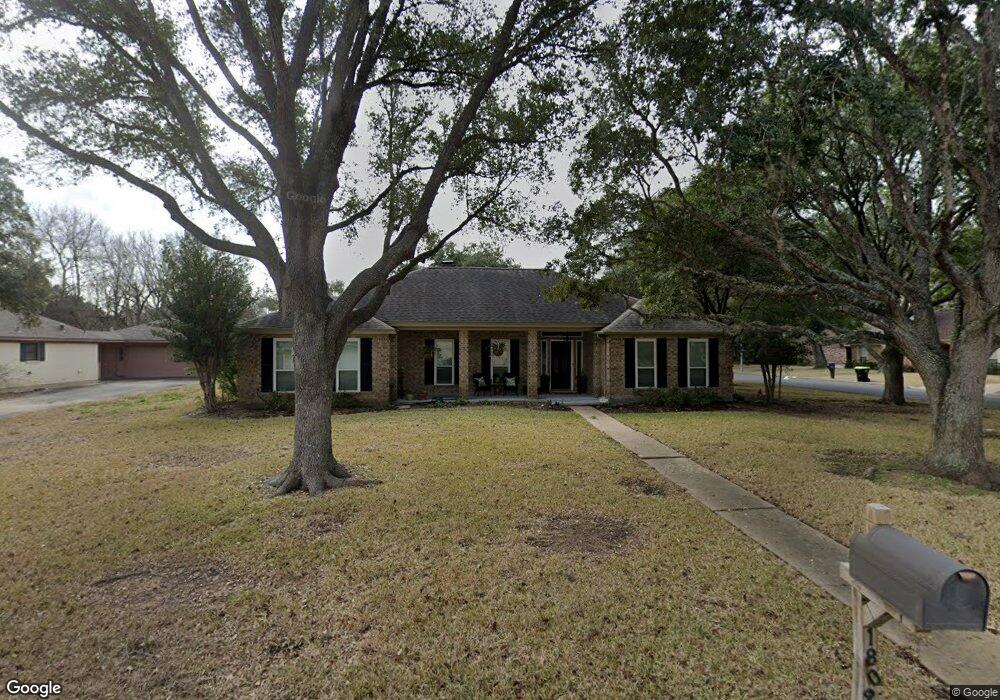
1809 Mulberry Dr Richmond, TX 77469
Estimated Value: $341,000 - $363,689
4
Beds
3
Baths
2,844
Sq Ft
$125/Sq Ft
Est. Value
About This Home
This home is located at 1809 Mulberry Dr, Richmond, TX 77469 and is currently estimated at $356,172, approximately $125 per square foot. 1809 Mulberry Dr is a home located in Fort Bend County with nearby schools including Smith Elementary School, J J Wessendorff Middle School, and Lamar Junior High School.
Ownership History
Date
Name
Owned For
Owner Type
Purchase Details
Closed on
Dec 8, 2021
Sold by
Jones Bailey Joanne
Bought by
Beard Lee Jay and Beard Michele Smith
Current Estimated Value
Purchase Details
Closed on
Apr 5, 2000
Sold by
Bailey Joanne Jones
Bought by
Bailey Joanne Jones and Will Of Frank D Bailey
Purchase Details
Closed on
Sep 12, 1995
Sold by
Krolczyk Henry
Bought by
Bailey Frank D and Bailey Joanne J
Home Financials for this Owner
Home Financials are based on the most recent Mortgage that was taken out on this home.
Original Mortgage
$20,000
Interest Rate
7.76%
Mortgage Type
Seller Take Back
Purchase Details
Closed on
Mar 10, 1994
Sold by
Mcgee Max A and Mcgee Sandra K
Bought by
Bailey Joanne J
Create a Home Valuation Report for This Property
The Home Valuation Report is an in-depth analysis detailing your home's value as well as a comparison with similar homes in the area
Home Values in the Area
Average Home Value in this Area
Purchase History
| Date | Buyer | Sale Price | Title Company |
|---|---|---|---|
| Beard Lee Jay | -- | New Title Company Name | |
| Bailey Joanne Jones | -- | -- | |
| Bailey Frank D | -- | Fort Bend Title Company | |
| Bailey Joanne J | -- | -- |
Source: Public Records
Mortgage History
| Date | Status | Borrower | Loan Amount |
|---|---|---|---|
| Previous Owner | Bailey Frank D | $20,000 |
Source: Public Records
Tax History Compared to Growth
Tax History
| Year | Tax Paid | Tax Assessment Tax Assessment Total Assessment is a certain percentage of the fair market value that is determined by local assessors to be the total taxable value of land and additions on the property. | Land | Improvement |
|---|---|---|---|---|
| 2025 | $5,310 | $375,100 | $32,078 | $353,122 |
| 2024 | $5,310 | $341,000 | -- | $358,515 |
| 2023 | $4,874 | $310,000 | $24,675 | $285,325 |
| 2022 | $6,855 | $353,590 | $24,680 | $328,910 |
| 2021 | $7,580 | $319,170 | $24,680 | $294,490 |
| 2020 | $7,318 | $303,630 | $24,680 | $278,950 |
| 2019 | $7,731 | $302,730 | $24,680 | $278,050 |
| 2018 | $7,636 | $297,220 | $24,680 | $272,540 |
| 2017 | $7,529 | $289,700 | $21,000 | $268,700 |
| 2016 | $7,072 | $272,100 | $21,000 | $251,100 |
| 2015 | $3,502 | $255,160 | $21,000 | $234,160 |
| 2014 | $3,482 | $237,550 | $21,000 | $216,550 |
Source: Public Records
Map
Nearby Homes
- 1809 Hawthorn Dr
- 1805 Hawthorn Dr
- 1806 Cedar Dr
- 1109 Frances Dr
- 1922 Teakwood St
- 4502 River Rd
- 1004 Country Club Dr
- 0 Fm 2218 Unit 25550047
- 2015 Tanglelane St
- 000 Fm 2218 Rd
- 4602 Avenue H
- 0 Meadow Ln
- 805 Chateau Place
- 512 and 514 Travis St
- 2001 Briar Ln
- 5121 Alderney Ct
- 1230 Law Ct
- 6303 Buffalo Bend Ln
- 6219 Deep Gulch Dr
- 6215 Deep Gulch Dr
- 1808 Hawthorn Dr
- 1806 Hawthorn Dr
- 1619 Cedar Dr
- 1702 Cedar Dr
- 1722 Magnolia Ln
- 1700 Cedar Dr
- 1704 Cedar Dr
- 1804 Hawthorn Dr
- 1706 Cedar Dr
- 1720 Magnolia Ln
- 1803 Mulberry Dr
- 1612 Cedar Dr
- 1802 Hawthorn Dr
- 1802 Mulberry Dr
- 1708 Cedar Dr
- 1304 Sally Anne Dr
- 1718 Magnolia Ln
- 1615 Cedar Dr
- 1801 Mulberry Dr
- 1807 Hawthorn Dr