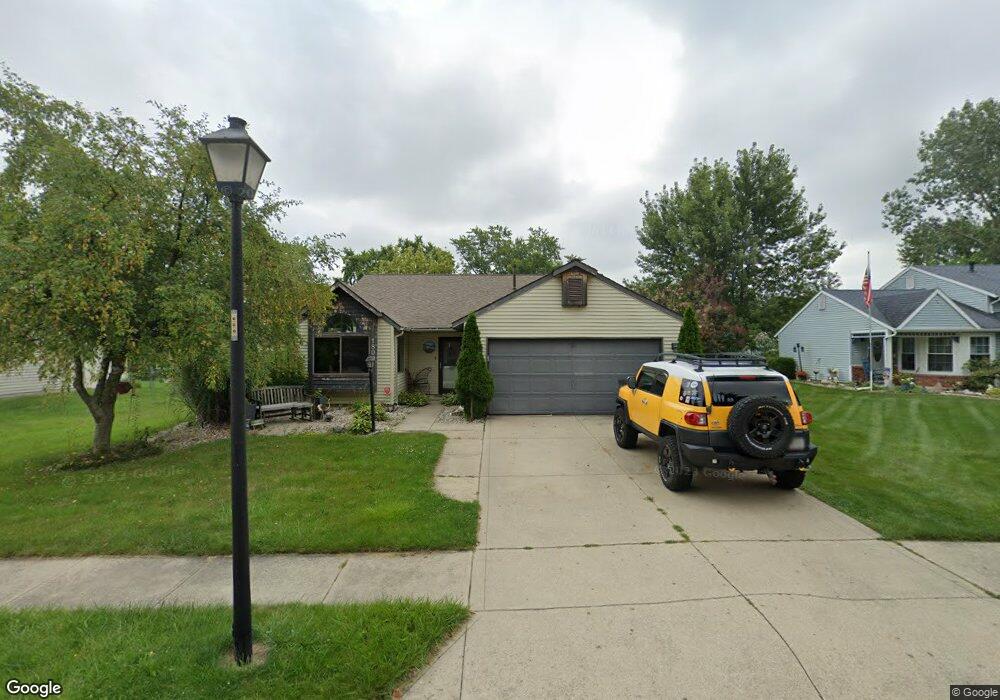
1809 Paveys Glen Run Fort Wayne, IN 46804
Estimated Value: $220,000 - $230,000
3
Beds
2
Baths
1,488
Sq Ft
$151/Sq Ft
Est. Value
About This Home
This home is located at 1809 Paveys Glen Run, Fort Wayne, IN 46804 and is currently estimated at $224,612, approximately $150 per square foot. 1809 Paveys Glen Run is a home located in Allen County with nearby schools including Lindley Elementary School, Portage Middle School, and Wayne High School.
Ownership History
Date
Name
Owned For
Owner Type
Purchase Details
Closed on
Sep 16, 2008
Sold by
Aschllman Kyle
Bought by
Reynolds Megan
Current Estimated Value
Home Financials for this Owner
Home Financials are based on the most recent Mortgage that was taken out on this home.
Original Mortgage
$86,328
Outstanding Balance
$57,557
Interest Rate
6.57%
Mortgage Type
FHA
Estimated Equity
$167,055
Purchase Details
Closed on
Sep 13, 2007
Sold by
Hud
Bought by
Aschliman Kyle
Home Financials for this Owner
Home Financials are based on the most recent Mortgage that was taken out on this home.
Original Mortgage
$86,100
Interest Rate
6.55%
Mortgage Type
Purchase Money Mortgage
Purchase Details
Closed on
Mar 6, 2007
Sold by
Abn Amro Mortgage Group Inc
Bought by
Hud
Purchase Details
Closed on
Feb 27, 2007
Sold by
Napier Gary P and Napier Cynthia J
Bought by
Abn Amro Mortgage Group Inc
Create a Home Valuation Report for This Property
The Home Valuation Report is an in-depth analysis detailing your home's value as well as a comparison with similar homes in the area
Home Values in the Area
Average Home Value in this Area
Purchase History
| Date | Buyer | Sale Price | Title Company |
|---|---|---|---|
| Reynolds Megan | -- | Metropolitan Title Of In | |
| Aschliman Kyle | -- | Village Title Inc | |
| Hud | -- | None Available | |
| Abn Amro Mortgage Group Inc | $94,605 | None Available |
Source: Public Records
Mortgage History
| Date | Status | Borrower | Loan Amount |
|---|---|---|---|
| Open | Reynolds Megan | $86,328 | |
| Previous Owner | Aschliman Kyle | $86,100 |
Source: Public Records
Tax History Compared to Growth
Tax History
| Year | Tax Paid | Tax Assessment Tax Assessment Total Assessment is a certain percentage of the fair market value that is determined by local assessors to be the total taxable value of land and additions on the property. | Land | Improvement |
|---|---|---|---|---|
| 2024 | $2,168 | $234,600 | $19,300 | $215,300 |
| 2022 | $1,884 | $169,200 | $19,300 | $149,900 |
| 2021 | $1,436 | $130,900 | $19,300 | $111,600 |
| 2020 | $1,346 | $125,300 | $19,300 | $106,000 |
| 2019 | $1,244 | $116,700 | $19,300 | $97,400 |
| 2018 | $1,223 | $114,200 | $19,300 | $94,900 |
| 2017 | $1,154 | $107,400 | $19,300 | $88,100 |
| 2016 | $933 | $95,000 | $19,300 | $75,700 |
| 2014 | $895 | $94,000 | $19,600 | $74,400 |
| 2013 | $1,044 | $102,500 | $19,600 | $82,900 |
Source: Public Records
Map
Nearby Homes
- 1809 Edenton Dr
- 1622 Briar Fence Ln
- 4930 Pinebrook Dr Unit 5
- 4905 Pinebrook Dr
- 4824 Palatine Dr
- 4716 Ridgelane Dr
- 1435 Reckeweg Rd
- 1406 Reckeweg Rd
- 2727 Club Terrace
- 2127 Bayside Ct
- 2101 Bayside Ct
- 6434 Covington Rd
- 4501 Taylor St
- 2441 Randall Rd
- 4401 Taylor St
- 4521 Covington Rd
- 6603 Quail Ridge Ln
- 6806 Covington Creek Trail
- 6728 Covington Creek Trail
- 7106 Inverness Dr
- 1805 Paveys Glen Run
- 1813 Paveys Glen Run
- 1801 Paveys Glen Run
- 1817 Paveys Glen Run
- 1630 Edenton Dr
- 1622 Edenton Dr
- 1706 Edenton Dr
- 1731 Paveys Glen Run
- 1614 Edenton Dr
- 1806 Paveys Glen Run
- 1712 Edenton Dr
- 1810 Paveys Glen Run
- 1802 Paveys Glen Run
- 1821 Paveys Glen Run
- 1606 Edenton Dr
- 1718 Edenton Dr
- 1727 Paveys Glen Run
- 5319 Welsh Glen Run
- 1814 Paveys Glen Run
- 1532 Edenton Dr