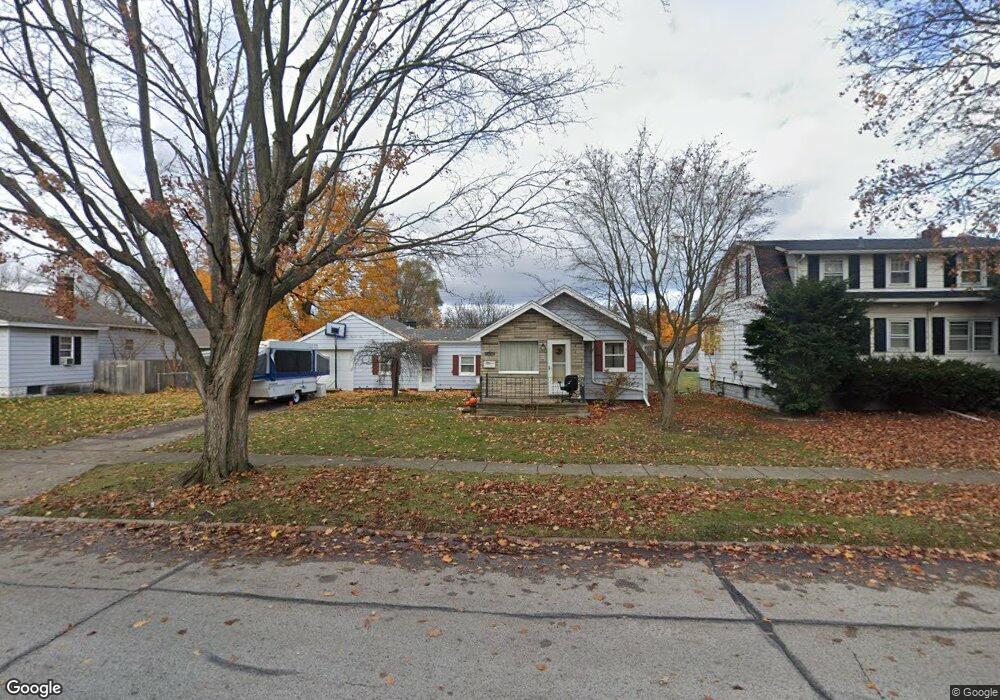
1809 Pine St Port Huron, MI 48060
Estimated Value: $112,000 - $148,000
3
Beds
1
Bath
1,280
Sq Ft
$100/Sq Ft
Est. Value
About This Home
This home is located at 1809 Pine St, Port Huron, MI 48060 and is currently estimated at $128,620, approximately $100 per square foot. 1809 Pine St is a home located in St. Clair County with nearby schools including Michigamme Elementary School, Central Middle School, and Port Huron High School.
Ownership History
Date
Name
Owned For
Owner Type
Purchase Details
Closed on
Apr 7, 2021
Sold by
Tebay Cathy S Charron
Bought by
Mata Michelle C
Current Estimated Value
Home Financials for this Owner
Home Financials are based on the most recent Mortgage that was taken out on this home.
Original Mortgage
$60,000
Outstanding Balance
$54,216
Interest Rate
3.05%
Mortgage Type
New Conventional
Estimated Equity
$74,404
Purchase Details
Closed on
Jan 20, 2011
Sold by
Charron Betty J and Charron William M
Bought by
Tebay Cathy S Charron
Create a Home Valuation Report for This Property
The Home Valuation Report is an in-depth analysis detailing your home's value as well as a comparison with similar homes in the area
Home Values in the Area
Average Home Value in this Area
Purchase History
| Date | Buyer | Sale Price | Title Company |
|---|---|---|---|
| Mata Michelle C | $75,000 | None Available | |
| Tebay Cathy S Charron | -- | None Available |
Source: Public Records
Mortgage History
| Date | Status | Borrower | Loan Amount |
|---|---|---|---|
| Open | Mata Michelle C | $60,000 |
Source: Public Records
Tax History
| Year | Tax Paid | Tax Assessment Tax Assessment Total Assessment is a certain percentage of the fair market value that is determined by local assessors to be the total taxable value of land and additions on the property. | Land | Improvement |
|---|---|---|---|---|
| 2025 | $2,297 | $64,400 | $0 | $0 |
| 2024 | $2,240 | $62,500 | $0 | $0 |
| 2023 | $2,116 | $57,000 | $0 | $0 |
| 2022 | $2,247 | $49,800 | $0 | $0 |
| 2020 | $1,199 | $45,100 | $45,100 | $0 |
| 2019 | $1,178 | $32,300 | $0 | $0 |
| 2018 | $1,152 | $32,300 | $0 | $0 |
| 2017 | $1,030 | $27,900 | $0 | $0 |
| 2016 | $873 | $27,900 | $0 | $0 |
| 2015 | $857 | $25,300 | $25,300 | $0 |
| 2014 | $857 | $23,900 | $23,900 | $0 |
| 2013 | -- | $24,000 | $0 | $0 |
Source: Public Records
Map
Nearby Homes
Your Personal Tour Guide
Ask me questions while you tour the home.