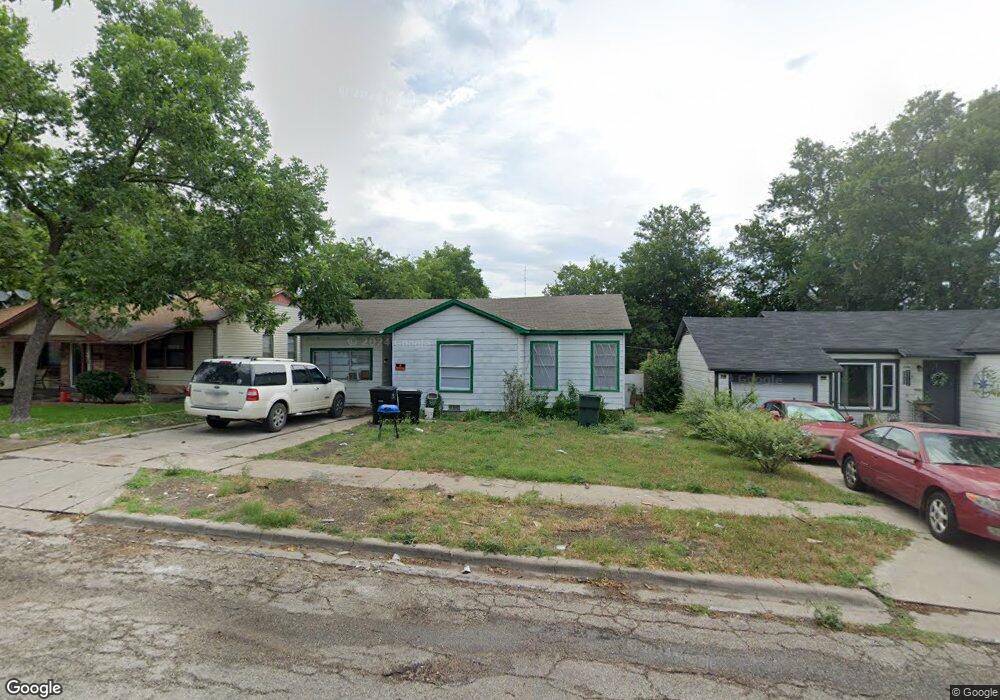
1809 S 3rd St Temple, TX 76504
TMED NeighborhoodEstimated Value: $122,604 - $171,000
Studio
1
Bath
1,137
Sq Ft
$137/Sq Ft
Est. Value
About This Home
This home is located at 1809 S 3rd St, Temple, TX 76504 and is currently estimated at $155,901, approximately $137 per square foot. 1809 S 3rd St is a home located in Bell County with nearby schools including Thornton Elementary School, Travis Science Academy, and Temple High School.
Ownership History
Date
Name
Owned For
Owner Type
Purchase Details
Closed on
Jul 28, 1998
Sold by
Huff Wendell Y
Bought by
Sims Betty
Current Estimated Value
Home Financials for this Owner
Home Financials are based on the most recent Mortgage that was taken out on this home.
Original Mortgage
$22,500
Interest Rate
6.94%
Mortgage Type
Seller Take Back
Purchase Details
Closed on
Jul 7, 1998
Sold by
Atkins Paul Wayne and Atkins Suzanne Renee
Bought by
Huff Wendell Y
Home Financials for this Owner
Home Financials are based on the most recent Mortgage that was taken out on this home.
Original Mortgage
$22,500
Interest Rate
6.94%
Mortgage Type
Seller Take Back
Create a Home Valuation Report for This Property
The Home Valuation Report is an in-depth analysis detailing your home's value as well as a comparison with similar homes in the area
Home Values in the Area
Average Home Value in this Area
Purchase History
| Date | Buyer | Sale Price | Title Company |
|---|---|---|---|
| Sims Betty | -- | -- | |
| Huff Wendell Y | $20,000 | -- |
Source: Public Records
Mortgage History
| Date | Status | Borrower | Loan Amount |
|---|---|---|---|
| Previous Owner | Sims Betty | $22,500 |
Source: Public Records
Tax History
| Year | Tax Paid | Tax Assessment Tax Assessment Total Assessment is a certain percentage of the fair market value that is determined by local assessors to be the total taxable value of land and additions on the property. | Land | Improvement |
|---|---|---|---|---|
| 2025 | $2,862 | $98,215 | $23,100 | $75,115 |
| 2024 | $2,297 | $101,931 | $23,100 | $78,831 |
| 2023 | $2,141 | $93,386 | $19,250 | $74,136 |
| 2022 | $1,956 | $81,697 | $12,650 | $69,047 |
| 2021 | $1,561 | $60,824 | $5,000 | $55,824 |
| 2020 | $1,465 | $54,589 | $5,000 | $49,589 |
| 2019 | $1,173 | $42,917 | $2,500 | $40,417 |
| 2018 | $1,375 | $49,891 | $2,500 | $47,391 |
| 2017 | $1,368 | $49,974 | $2,500 | $47,474 |
| 2016 | $1,298 | $47,397 | $2,500 | $44,897 |
| 2015 | $1,214 | $47,433 | $2,500 | $44,933 |
| 2014 | $1,214 | $46,145 | $0 | $0 |
Source: Public Records
Map
Nearby Homes
Your Personal Tour Guide
Ask me questions while you tour the home.