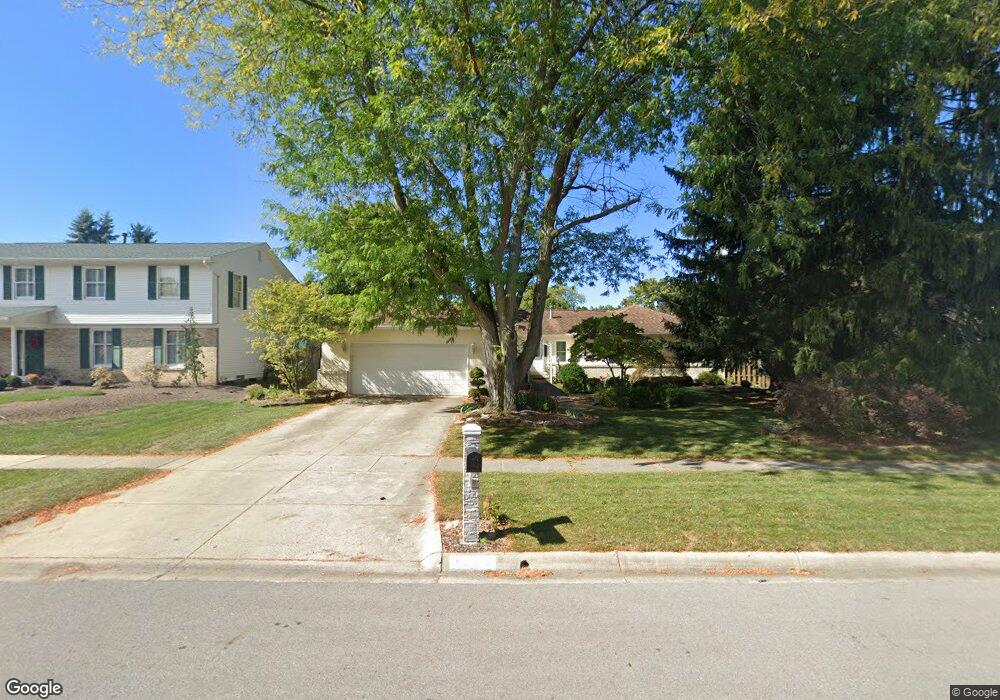
1809 Stemwood Dr Columbus, OH 43228
Timberbrook NeighborhoodEstimated Value: $363,285 - $416,000
4
Beds
2
Baths
1,889
Sq Ft
$207/Sq Ft
Est. Value
About This Home
This home is located at 1809 Stemwood Dr, Columbus, OH 43228 and is currently estimated at $391,571, approximately $207 per square foot. 1809 Stemwood Dr is a home located in Franklin County with nearby schools including Hilliard Horizon Elementary School, Hilliard Station Sixth Grade Elementary School, and Hilliard Memorial Middle School.
Ownership History
Date
Name
Owned For
Owner Type
Purchase Details
Closed on
Oct 2, 2019
Sold by
Brooks Tamra D
Bought by
Henderson Gary A
Current Estimated Value
Home Financials for this Owner
Home Financials are based on the most recent Mortgage that was taken out on this home.
Original Mortgage
$235,922
Outstanding Balance
$204,845
Interest Rate
3.5%
Mortgage Type
VA
Estimated Equity
$186,726
Purchase Details
Closed on
Jan 11, 2006
Sold by
Brooks Randy L and Brooks Tamra D
Bought by
Brooks Randy L and Brooks Tamra D
Purchase Details
Closed on
Aug 21, 2003
Sold by
Lefevre Lisa W
Bought by
Brooks Randy L and Brooks Tamra D
Home Financials for this Owner
Home Financials are based on the most recent Mortgage that was taken out on this home.
Original Mortgage
$146,400
Interest Rate
5.69%
Mortgage Type
Balloon
Purchase Details
Closed on
Jun 30, 1989
Create a Home Valuation Report for This Property
The Home Valuation Report is an in-depth analysis detailing your home's value as well as a comparison with similar homes in the area
Home Values in the Area
Average Home Value in this Area
Purchase History
| Date | Buyer | Sale Price | Title Company |
|---|---|---|---|
| Henderson Gary A | $258,900 | None Available | |
| Brooks Randy L | -- | None Available | |
| Brooks Randy L | $183,000 | Christopher Land Title Inc | |
| -- | $106,000 | -- |
Source: Public Records
Mortgage History
| Date | Status | Borrower | Loan Amount |
|---|---|---|---|
| Open | Henderson Gary A | $235,922 | |
| Previous Owner | Brooks Randy L | $146,400 | |
| Closed | Brooks Randy L | $27,450 |
Source: Public Records
Tax History
| Year | Tax Paid | Tax Assessment Tax Assessment Total Assessment is a certain percentage of the fair market value that is determined by local assessors to be the total taxable value of land and additions on the property. | Land | Improvement |
|---|---|---|---|---|
| 2025 | $6,369 | $95,100 | $22,860 | $72,240 |
| 2024 | $6,369 | $95,100 | $22,860 | $72,240 |
| 2023 | $5,183 | $95,100 | $22,860 | $72,240 |
| 2022 | $5,437 | $78,970 | $14,810 | $64,160 |
| 2021 | $5,433 | $78,970 | $14,810 | $64,160 |
| 2020 | $5,420 | $78,970 | $14,810 | $64,160 |
| 2019 | $5,045 | $62,340 | $11,830 | $50,510 |
| 2018 | $4,895 | $62,340 | $11,830 | $50,510 |
| 2017 | $5,026 | $62,340 | $11,830 | $50,510 |
| 2016 | $5,040 | $57,750 | $13,300 | $44,450 |
| 2015 | $4,762 | $57,750 | $13,300 | $44,450 |
| 2014 | $4,771 | $57,750 | $13,300 | $44,450 |
| 2013 | $2,422 | $57,750 | $13,300 | $44,450 |
Source: Public Records
Map
Nearby Homes
- 5932 Waterview Dr
- 1805 Galleon Blvd
- 5981 Lakefront Ave
- 1777 Melanzana Dr Unit Lot 34
- 1686 Jupiter Ave
- 1993 Schrive Dr
- 1843 Melanzana Dr Unit Lot 225
- 1849 Melanzana Dr Unit Lot 224
- 1656 Jupiter Ave
- 1756 Zucchina Dr
- 1848 Zucchina Dr Unit Lot 207
- 1853 Zucchina Dr Unit Lot 168
- 1902 Cavolo Dr
- 1730 Ridgebury Dr Unit 139D
- 1837 Messner Dr
- 5762 Belmore Dr Unit 145E
- 5728 Snow Dr Unit 128C
- 1668 Blackhorse Ln Unit 157B
- 5721 Gadston Way
- 5699 Palos Ln Unit 167C
- 1801 Stemwood Dr
- 1827 Stemwood Dr
- 1822 Hickory Hill Dr
- 1787 Stemwood Dr
- 1845 Stemwood Dr
- 1802 Stemwood Dr
- 1810 Stemwood Dr
- 6094 Hickory Hill Place
- 1818 Hickory Hill Dr
- 1794 Stemwood Dr
- 1818 Stemwood Dr
- 1779 Stemwood Dr
- 6086 Hickory Hill Place
- 1786 Stemwood Dr
- 1834 Stemwood Dr
- 1826 Stemwood Dr
- 1842 Stemwood Dr
- 1797 Spindler Rd
- 1805 Spindler Rd
- 1832 Hickory Hill Dr
Your Personal Tour Guide
Ask me questions while you tour the home.