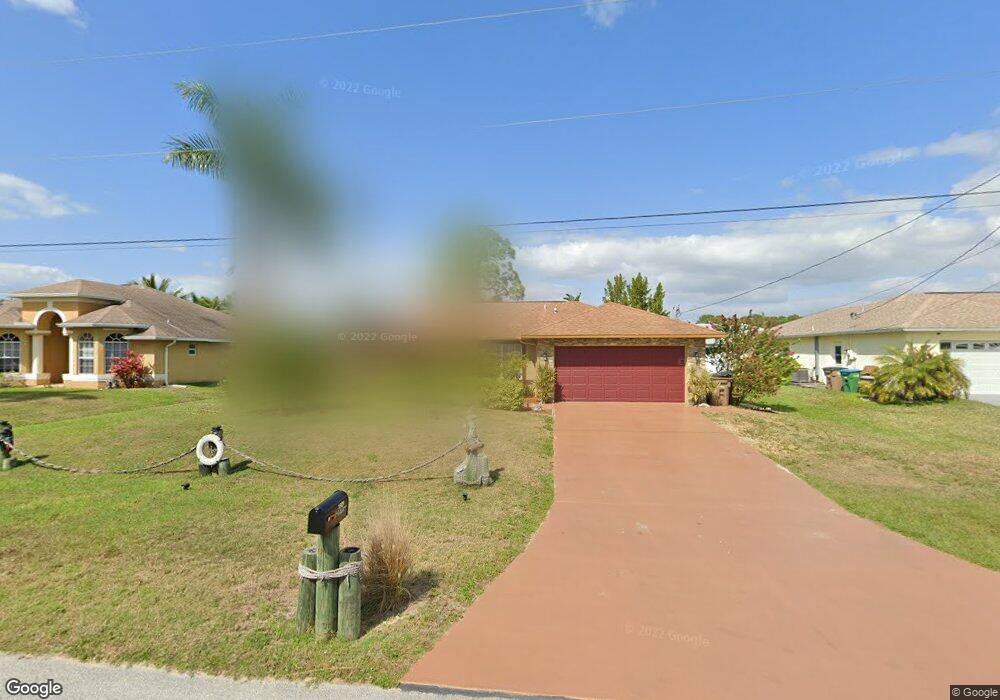
1809 SW 21st Terrace Unit 31 Cape Coral, FL 33991
Trafalgar NeighborhoodEstimated Value: $275,273 - $300,000
3
Beds
2
Baths
1,448
Sq Ft
$200/Sq Ft
Est. Value
About This Home
This home is located at 1809 SW 21st Terrace Unit 31, Cape Coral, FL 33991 and is currently estimated at $289,068, approximately $199 per square foot. 1809 SW 21st Terrace Unit 31 is a home located in Lee County with nearby schools including Caloosa Elementary School, Cape Elementary School, and Tropic Isles Elementary School.
Ownership History
Date
Name
Owned For
Owner Type
Purchase Details
Closed on
Mar 6, 2009
Sold by
Danata Group Llc
Bought by
Toye Clifford A
Current Estimated Value
Home Financials for this Owner
Home Financials are based on the most recent Mortgage that was taken out on this home.
Original Mortgage
$95,243
Outstanding Balance
$60,594
Interest Rate
5.14%
Mortgage Type
FHA
Estimated Equity
$228,474
Purchase Details
Closed on
Jul 28, 2008
Sold by
Kaczynski Michael John
Bought by
Danata Group Llc
Purchase Details
Closed on
Mar 4, 2008
Sold by
Rcr Family Properties Llc
Bought by
The Deltona Corp
Purchase Details
Closed on
Mar 11, 1999
Sold by
Gwin Lillian and Gwin Robert H
Bought by
Ball Keith G and Ball Karen A
Home Financials for this Owner
Home Financials are based on the most recent Mortgage that was taken out on this home.
Original Mortgage
$95,109
Interest Rate
6.82%
Mortgage Type
FHA
Create a Home Valuation Report for This Property
The Home Valuation Report is an in-depth analysis detailing your home's value as well as a comparison with similar homes in the area
Home Values in the Area
Average Home Value in this Area
Purchase History
| Date | Buyer | Sale Price | Title Company |
|---|---|---|---|
| Toye Clifford A | $97,000 | Fidelity National Title Insu | |
| Danata Group Llc | $47,300 | None Available | |
| The Deltona Corp | -- | Attorney | |
| Ball Keith G | $4,000 | -- |
Source: Public Records
Mortgage History
| Date | Status | Borrower | Loan Amount |
|---|---|---|---|
| Open | Toye Clifford A | $95,243 | |
| Previous Owner | Ball Keith G | $95,109 |
Source: Public Records
Tax History Compared to Growth
Tax History
| Year | Tax Paid | Tax Assessment Tax Assessment Total Assessment is a certain percentage of the fair market value that is determined by local assessors to be the total taxable value of land and additions on the property. | Land | Improvement |
|---|---|---|---|---|
| 2025 | $1,665 | $235,713 | $68,638 | $167,075 |
| 2024 | $1,566 | $75,726 | -- | -- |
| 2023 | $1,566 | $73,520 | $0 | $0 |
| 2022 | $1,423 | $71,379 | $0 | $0 |
| 2021 | $1,372 | $152,347 | $28,000 | $124,347 |
| 2020 | $1,359 | $68,343 | $0 | $0 |
| 2019 | $3,208 | $66,806 | $0 | $0 |
| 2018 | $3,173 | $65,560 | $0 | $0 |
| 2017 | $3,143 | $64,212 | $0 | $0 |
| 2016 | $3,109 | $115,497 | $10,000 | $105,497 |
| 2015 | $3,161 | $90,906 | $7,000 | $83,906 |
| 2014 | $3,090 | $92,809 | $5,640 | $87,169 |
| 2013 | -- | $73,704 | $4,400 | $69,304 |
Source: Public Records
Map
Nearby Homes
- 1807 SW 21st Ln
- 1817 SW 21st Ln
- 1721 SW 21st Ln
- 1726 SW 21st St
- 2131 SW 17th Place
- 2139 SW 17th Place
- 1817 SW 22nd Terrace
- 2111 SW 17th Place
- 2210 SW 19th Ave
- 2013 SW 19th Place
- 2309 SW 19th Place
- 2247 SW 17th Place
- 1708 SW 17th Ave
- 2106 SW 17th Ave
- 1618 SW 23rd St
- 2060 Cape Heather Cir
- 9 SW 22nd St
- 2134 SW 22nd Terrace
- 2088 Cape Heather Cir
- 2007 SW 15th Place
- 1805 SW 21st Terrace
- 1813 SW 21st Terrace
- 1810 SW 21st St
- 1814 SW 21st St
- 1817 SW 21st Terrace
- 1801 SW 21st Terrace
- 1812 SW 21st Terrace
- 1808 SW 21st Terrace
- 1802 SW 21st St
- 1818 SW 21st St
- 1816 SW 21st Terrace
- 1821 SW 21st Terrace
- 1822 SW 21st St
- 1732 SW 21st St
- 1820 SW 21st Terrace
- 1729 SW 21st Terrace
- 1732 SW 21st Terrace
- 1807 SW 21st Ln
- 1809 SW 21st St